Bank of America 2012 Annual Report Download - page 275
Download and view the complete annual report
Please find page 275 of the 2012 Bank of America annual report below. You can navigate through the pages in the report by either clicking on the pages listed below, or by using the keyword search tool below to find specific information within the annual report.-
 1
1 -
2
-
3
-
4
-
5
-
6
-
7
-
8
-
9
-
10
-
11
-
12
-
13
-
14
-
15
-
16
-
17
-
18
-
19
-
20
-
21
-
22
-
23
-
24
-
25
-
26
-
27
-
28
-
29
-
30
-
31
-
32
-
33
-
34
-
35
-
36
-
37
-
38
-
39
-
40
-
41
-
42
-
43
-
44
-
45
-
46
-
47
-
48
-
49
-
50
-
51
-
52
-
53
-
54
-
55
-
56
-
57
-
58
-
59
-
60
-
61
-
62
-
63
-
64
-
65
-
66
-
67
-
68
-
69
-
70
-
71
-
72
-
73
-
74
-
75
-
76
-
77
-
78
-
79
-
80
-
81
-
82
-
83
-
84
-
85
-
86
-
87
-
88
-
89
-
90
-
91
-
92
-
93
-
94
-
95
-
96
-
97
-
98
-
99
-
100
-
101
-
102
-
103
-
104
-
105
-
106
-
107
-
108
-
109
-
110
-
111
-
112
-
113
-
114
-
115
-
116
-
117
-
118
-
119
-
120
-
121
-
122
-
123
-
124
-
125
-
126
-
127
-
128
-
129
-
130
-
131
-
132
-
133
-
134
-
135
-
136
-
137
-
138
-
139
-
140
-
141
-
142
-
143
-
144
-
145
-
146
-
147
-
148
-
149
-
150
-
151
-
152
-
153
-
154
-
155
-
156
-
157
-
158
-
159
-
160
-
161
-
162
-
163
-
164
-
165
-
166
-
167
-
168
-
169
-
170
-
171
-
172
-
173
-
174
-
175
-
176
-
177
-
178
-
179
-
180
-
181
-
182
-
183
-
184
-
185
-
186
-
187
-
188
-
189
-
190
-
191
-
192
-
193
-
194
-
195
-
196
-
197
-
198
-
199
-
200
-
201
-
202
-
203
-
204
-
205
-
206
-
207
-
208
-
209
-
210
-
211
-
212
-
213
-
214
-
215
-
216
-
217
-
218
-
219
-
220
-
221
-
222
-
223
-
224
-
225
-
226
-
227
-
228
-
229
-
230
-
231
-
232
-
233
-
234
-
235
-
236
-
237
-
238
-
239
-
240
-
241
-
242
-
243
-
244
-
245
-
246
-
247
-
248
-
249
-
250
-
251
-
252
-
253
-
254
-
255
-
256
-
257
-
258
-
259
-
260
-
261
-
262
-
263
-
264
-
 265
265 -
 266
266 -
 267
267 -
 268
268 -
 269
269 -
 270
270 -
 271
271 -
 272
272 -
 273
273 -
 274
274 -
 275
275 -
 276
276 -
 277
277 -
 278
278 -
 279
279 -
 280
280 -
 281
281 -
 282
282 -
 283
283 -
 284
284
 |
 |

Bank of America 2012 273
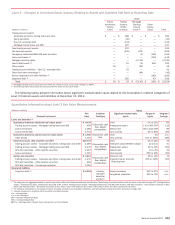
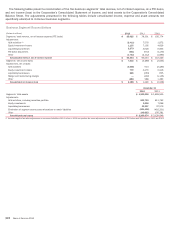
The following tables present total revenue, net of interest expense, on a FTE basis, and net income (loss) for 2012, 2011 and 2010,
and total assets at December 31, 2012 and 2011 for each business segment, as well as All Other.
Business Segments
At and for the Year Ended December 31 Total Corporation (1) Consumer & Business Banking Consumer Real Estate Services
(Dollars in millions) 2012 2011 2010 2012 2011 2010 2012 2011 2010
Net interest income (FTE basis) $ 41,557 $ 45,588 $ 52,693 $ 19,125 $ 21,378 $ 24,299 $ 2,959 $ 3,207 $ 4,662
Noninterest income (loss) 42,678 48,838 58,697 9,898 11,502 13,888 5,800 (6,361) 5,667
Total revenue, net of interest expense (FTE basis) 84,235 94,426 111,390 29,023 32,880 38,187 8,759 (3,154) 10,329
Provision for credit losses 8,169 13,410 28,435 3,941 3,490 11,647 1,442 4,524 8,490
Amortization of intangibles 1,264 1,509 1,731 626 759 870 —11 38
Goodwill impairment —3,184 12,400 —— 10,400 —2,603 2,000
Other noninterest expense 70,829 75,581 68,977 16,167 16,960 17,316 17,306 19,177 12,762
Income (loss) before income taxes 3,973 742 (153) 8,289 11,671 (2,046) (9,989)(29,469) (12,961)
Income tax expense (benefit) (FTE basis) (215) (704) 2,085 2,968 4,224 3,089 (3,482)(10,004) (4,068)
Net income (loss) $ 4,188 $ 1,446 $ (2,238) $ 5,321 $ 7,447 $ (5,135) $(6,507)$ (19,465) $ (8,893)
Year-end total assets $ 2,209,974 $2,129,046 $ 554,878 $521,097 $ 132,388 $163,712
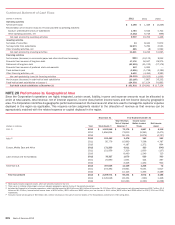
Global Banking Global Markets
2012 2011 2010 2012 2011 2010
Net interest income (FTE basis) $ 9,225 $ 9,490 $ 10,062 $ 3,310 $ 3,682 $ 4,332
Noninterest income 7,982 7,822 7,682 10,209 11,116 14,799
Total revenue, net of interest expense (FTE basis) 17,207 17,312 17,744 13,519 14,798 19,131
Provision for credit losses (103) (1,118) 1,298 3(56) 30
Amortization of intangibles 79 102 121 64 66 66
Other noninterest expense 8,229 8,782 8,548 10,775 12,178 11,708
Income before income taxes 9,002 9,546 7,777 2,677 2,610 7,327
Income tax expense (FTE basis) 3,277 3,500 2,887 1,623 1,622 3,076
Net income $ 5,725 $ 6,046 $ 4,890 $ 1,054 $ 988 $ 4,251
Year-end total assets $ 362,797 $348,773 $ 615,297 $501,867
Global Wealth &
Investment Management All Other
2012 2011 2010 2012 2011 2010
Net interest income (FTE basis) $ 5,827 $ 5,885 $ 5,547 $ 1,111 $ 1,946 $ 3,791
Noninterest income (loss) 10,690 10,610 9,836 (1,901)14,149 6,825
Total revenue, net of interest expense (FTE basis) 16,517 16,495 15,383 (790) 16,095 10,616
Provision for credit losses 266 398 646 2,620 6,172 6,324
Amortization of intangibles 414 438 458 81 133 178
Goodwill impairment ——— —581 —
Other noninterest expense 12,341 12,945 11,861 6,011 5,539 6,782
Income (loss) before income taxes 3,496 2,714 2,418 (9,502)3,670 (2,668)
Income tax expense (benefit) (FTE basis) 1,273 996 1,076 (5,874)(1,042) (3,975)
Net income (loss) $ 2,223 $ 1,718 $ 1,342 $(3,628)$ 4,712 $ 1,307
Year-end total assets $ 297,330 $273,106 $ 247,284 $320,491
(1) There were no material intersegment revenues.