Bank of America 2012 Annual Report Download - page 157
Download and view the complete annual report
Please find page 157 of the 2012 Bank of America annual report below. You can navigate through the pages in the report by either clicking on the pages listed below, or by using the keyword search tool below to find specific information within the annual report.-
 1
1 -
2
-
3
-
4
-
5
-
6
-
7
-
8
-
9
-
10
-
11
-
12
-
13
-
14
-
15
-
16
-
17
-
18
-
19
-
20
-
21
-
22
-
23
-
24
-
25
-
26
-
27
-
28
-
29
-
30
-
31
-
32
-
33
-
34
-
35
-
36
-
37
-
38
-
39
-
40
-
41
-
42
-
43
-
44
-
45
-
46
-
47
-
48
-
49
-
50
-
51
-
52
-
53
-
54
-
55
-
56
-
57
-
58
-
59
-
60
-
61
-
62
-
63
-
64
-
65
-
66
-
67
-
68
-
69
-
70
-
71
-
72
-
73
-
74
-
75
-
76
-
77
-
78
-
79
-
80
-
81
-
82
-
83
-
84
-
85
-
86
-
87
-
88
-
89
-
90
-
91
-
92
-
93
-
94
-
95
-
96
-
97
-
98
-
99
-
100
-
101
-
102
-
103
-
104
-
105
-
106
-
107
-
108
-
109
-
110
-
111
-
112
-
113
-
114
-
115
-
116
-
117
-
118
-
119
-
120
-
121
-
122
-
123
-
124
-
125
-
126
-
127
-
128
-
129
-
130
-
131
-
132
-
133
-
134
-
135
-
136
-
137
-
138
-
139
-
140
-
141
-
142
-
143
-
144
-
145
-
146
-
 147
147 -
 148
148 -
 149
149 -
 150
150 -
 151
151 -
 152
152 -
 153
153 -
 154
154 -
 155
155 -
 156
156 -
 157
157 -
 158
158 -
 159
159 -
 160
160 -
 161
161 -
 162
162 -
 163
163 -
 164
164 -
 165
165 -
 166
166 -
 167
167 -
168
-
169
-
170
-
171
-
172
-
173
-
174
-
175
-
176
-
177
-
178
-
179
-
180
-
181
-
182
-
183
-
184
-
185
-
186
-
187
-
188
-
189
-
190
-
191
-
192
-
193
-
194
-
195
-
196
-
197
-
198
-
199
-
200
-
201
-
202
-
203
-
204
-
205
-
206
-
207
-
208
-
209
-
210
-
211
-
212
-
213
-
214
-
215
-
216
-
217
-
218
-
219
-
220
-
221
-
222
-
223
-
224
-
225
-
226
-
227
-
228
-
229
-
230
-
231
-
232
-
233
-
234
-
235
-
236
-
237
-
238
-
239
-
240
-
241
-
242
-
243
-
244
-
245
-
246
-
247
-
248
-
249
-
250
-
251
-
252
-
253
-
254
-
255
-
256
-
257
-
258
-
259
-
260
-
261
-
262
-
263
-
264
-
265
-
266
-
267
-
268
-
269
-
270
-
271
-
272
-
273
-
274
-
275
-
276
-
277
-
278
-
279
-
280
-
281
-
282
-
283
-
284
 |
 |

Bank of America 2012 155
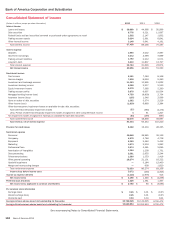
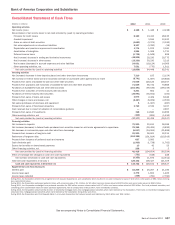
Bank of America Corporation and Subsidiaries
Consolidated Balance Sheet (continued)
December 31
(Dollars in millions) 2012 2011
Liabilities
Deposits in U.S. offices:
Noninterest-bearing $ 372,546 $ 332,228
Interest-bearing (includes $2,262 and $3,297 measured at fair value) 654,332 624,814
Deposits in non-U.S. offices:
Noninterest-bearing 7,573 6,839
Interest-bearing 70,810 69,160
Total deposits 1,105,261 1,033,041
Federal funds purchased and securities loaned or sold under agreements to repurchase (includes $42,639 and $34,235 measured at fair
value) 293,259 214,864
Trading account liabilities 73,587 60,508
Derivative liabilities 46,016 59,520
Commercial paper and other short-term borrowings (includes $4,074 and $6,558 measured at fair value) 30,731 35,698
Accrued expenses and other liabilities (includes $16,594 and $15,743 measured at fair value and $513 and $714 of reserve for
unfunded lending commitments) 148,579 123,049
Long-term debt (includes $49,161 and $46,239 measured at fair value) 275,585 372,265
Total liabilities 1,973,018 1,898,945
Commitments and contingencies (Note 7 – Securitizations and Other Variable Interest Entities, Note 8 – Representations and Warranties
Obligations and Corporate Guarantees and Note 13 – Commitments and Contingencies)
Shareholders’ equity
Preferred stock, $0.01 par value; authorized – 100,000,000 shares; issued and outstanding – 3,685,410 and 3,689,084 shares 18,768 18,397
Common stock and additional paid-in capital, $0.01 par value; authorized – 12,800,000,000 shares; issued and outstanding –
10,778,263,628 and 10,535,937,957 shares 158,142 156,621
Retained earnings 62,843 60,520
Accumulated other comprehensive income (loss) (2,797)(5,437)
Total shareholders’ equity 236,956 230,101
Total liabilities and shareholders’ equity $ 2,209,974 $ 2,129,046
Liabilities of consolidated variable interest entities included in total liabilities above
Commercial paper and other short-term borrowings (includes $872 and $650 of non-recourse liabilities) $ 3,731 $ 5,777
Long-term debt (includes $29,476 and $44,976 of non-recourse debt) 34,256 49,054
All other liabilities (includes $149 and $225 of non-recourse liabilities) 360 1,116
Total liabilities of consolidated variable interest entities $ 38,347 $ 55,947
See accompanying Notes to Consolidated Financial Statements.