Bank of America 2012 Annual Report Download - page 272
Download and view the complete annual report
Please find page 272 of the 2012 Bank of America annual report below. You can navigate through the pages in the report by either clicking on the pages listed below, or by using the keyword search tool below to find specific information within the annual report.-
 1
1 -
2
-
3
-
4
-
5
-
6
-
7
-
8
-
9
-
10
-
11
-
12
-
13
-
14
-
15
-
16
-
17
-
18
-
19
-
20
-
21
-
22
-
23
-
24
-
25
-
26
-
27
-
28
-
29
-
30
-
31
-
32
-
33
-
34
-
35
-
36
-
37
-
38
-
39
-
40
-
41
-
42
-
43
-
44
-
45
-
46
-
47
-
48
-
49
-
50
-
51
-
52
-
53
-
54
-
55
-
56
-
57
-
58
-
59
-
60
-
61
-
62
-
63
-
64
-
65
-
66
-
67
-
68
-
69
-
70
-
71
-
72
-
73
-
74
-
75
-
76
-
77
-
78
-
79
-
80
-
81
-
82
-
83
-
84
-
85
-
86
-
87
-
88
-
89
-
90
-
91
-
92
-
93
-
94
-
95
-
96
-
97
-
98
-
99
-
100
-
101
-
102
-
103
-
104
-
105
-
106
-
107
-
108
-
109
-
110
-
111
-
112
-
113
-
114
-
115
-
116
-
117
-
118
-
119
-
120
-
121
-
122
-
123
-
124
-
125
-
126
-
127
-
128
-
129
-
130
-
131
-
132
-
133
-
134
-
135
-
136
-
137
-
138
-
139
-
140
-
141
-
142
-
143
-
144
-
145
-
146
-
147
-
148
-
149
-
150
-
151
-
152
-
153
-
154
-
155
-
156
-
157
-
158
-
159
-
160
-
161
-
162
-
163
-
164
-
165
-
166
-
167
-
168
-
169
-
170
-
171
-
172
-
173
-
174
-
175
-
176
-
177
-
178
-
179
-
180
-
181
-
182
-
183
-
184
-
185
-
186
-
187
-
188
-
189
-
190
-
191
-
192
-
193
-
194
-
195
-
196
-
197
-
198
-
199
-
200
-
201
-
202
-
203
-
204
-
205
-
206
-
207
-
208
-
209
-
210
-
211
-
212
-
213
-
214
-
215
-
216
-
217
-
218
-
219
-
220
-
221
-
222
-
223
-
224
-
225
-
226
-
227
-
228
-
229
-
230
-
231
-
232
-
233
-
234
-
235
-
236
-
237
-
238
-
239
-
240
-
241
-
242
-
243
-
244
-
245
-
246
-
247
-
248
-
249
-
250
-
251
-
252
-
253
-
254
-
255
-
256
-
257
-
258
-
259
-
260
-
261
-
 262
262 -
 263
263 -
 264
264 -
 265
265 -
 266
266 -
 267
267 -
 268
268 -
 269
269 -
 270
270 -
 271
271 -
 272
272 -
 273
273 -
 274
274 -
 275
275 -
 276
276 -
 277
277 -
 278
278 -
 279
279 -
 280
280 -
 281
281 -
 282
282 -
283
-
284
 |
 |

270 Bank of America 2012
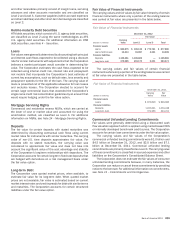
NOTE 24 Mortgage Servicing Rights
The Corporation accounts for consumer MSRs at fair value with
changes in fair value recorded in the Corporation’s Consolidated
Statement of Income in mortgage banking income (loss). The
Corporation manages the risk in these MSRs with securities
including MBS and U.S. Treasuries, as well as certain derivatives
such as options and interest rate swaps, which are not designated
as accounting hedges. The securities used to manage the risk in
the MSRs are classified in other assets with changes in the fair
value of the securities and the related interest income recorded
in mortgage banking income (loss).
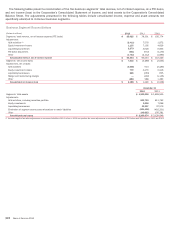
The table below presents activity for residential first-lien MSRs
for 2012 and 2011. Commercial and residential reverse MSRs,
which are carried at the lower of cost or market value and
accounted for using the amortization method, totaled $135 million
and $132 million at December 31, 2012 and 2011, and are not
included in the tables in this Note.
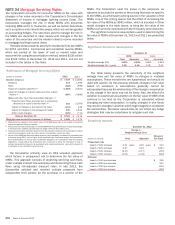
Rollforward of Mortgage Servicing Rights
(Dollars in millions) 2012 2011
Balance, January 1 $ 7,378 $ 14,900
Additions 374 1,656
Sales (122) (896)
Impact of customer payments (1) (1,484) (2,621)
Impact of changes in interest rates and other market
factors (2) (867) (4,890)
Model and other cash flow assumption changes: (3)
Projected cash flows, primarily due to (increases)
decreases in costs to service loans (4) 443 (2,306)
Impact of changes in the Home Price Index (112) 428
Impact of changes to the prepayment model 435 1,818
Other model changes (329) (711)
Balance, December 31 $ 5,716 $ 7,378
Mortgage loans serviced for investors (in billions) $ 1,045 $ 1,379
(1) Represents the change in the market value of the MSR asset due to the impact of customer
payments received during the period.
(2) These amounts reflect the changes in modeled MSR fair value primarily due to observed changes
in interest rates, volatility, spreads and the shape of the forward swap curve.
(3) These amounts reflect periodic adjustments to the valuation model as well as changes in certain
cash flow assumptions such as cost to service and ancillary income per loan.
(4) As part of the MSR fair value estimation process, the Corporation increased its estimated cost
to service during 2011 due to higher costs expected from foreclosure delays and procedures,
the implementation of various loan modification programs, and compliance with new banking
regulations. During 2012, the Corporation has continued to refine its estimates of cost to
service and ancillary income to be consistent with market participants’ view which resulted in
a decrease to the estimated cost to service.
The Corporation primarily uses an OAS valuation approach
which factors in prepayment risk to determine the fair value of
MSRs. This approach consists of projecting servicing cash flows
under multiple interest rate scenarios and discounting these cash
flows using risk-adjusted discount rates. In late 2012, the
Corporation solicited and received multiple proposals from
independent third parties for the purchase of a portion of the
MSRs. The Corporation used the prices in the proposals, as
adjusted to exclude the portion of the pricing that was not specific
to the MSRs, as a third-party pricing source in the valuation of the
MSRs. Use of this pricing source had the effect of increasing the
fair value of the MSRs by $342 million, which is included in Other
model changes in the table above, to bring the fair value of the
MSRs to an amount consistent with the third-party price discovery.
The significant economic assumptions used in determining the
fair value of MSRs at December 31, 2012 and 2011 are presented
below.
Significant Economic Assumptions
December 31
2012 2011
Fixed Adjustable Fixed Adjustable
Weighted-average OAS 4.00% 6.63% 2.80% 5.61%
Weighted-average life, in years 3.65 2.10 3.78 2.10
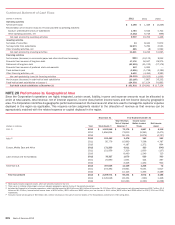
The table below presents the sensitivity of the weighted-
average lives and fair value of MSRs to changes in modeled
assumptions. These sensitivities are hypothetical and should be
used with caution. As the amounts indicate, changes in fair value
based on variations in assumptions generally cannot be
extrapolated because the relationship of the change in assumption
to the change in fair value may not be linear. Also, the effect of a
variation in a particular assumption on the fair value of MSRs that
continue to be held by the Corporation is calculated without
changing any other assumption. In reality, changes in one factor
may result in changes in another, which might magnify or counteract
the sensitivities. The below sensitivities do not reflect any hedge
strategies that may be undertaken to mitigate such risk.
Sensitivity Impacts
December 31, 2012
Change in
Weighted-average Lives
(Dollars in millions) Fixed Adjustable
Change in
Fair Value
Prepayment rates
Impact of 10% decrease 0.31 years 0.20 years $ 510
Impact of 20% decrease 0.67 0.43 1,094
Impact of 10% increase (0.27) (0.17) (450)
Impact of 20% increase (0.51) (0.32) (849)
OAS level
Impact of 100 bps decrease $ 256
Impact of 200 bps decrease 535
Impact of 100 bps increase (237)
Impact of 200 bps increase (455)