Bank of America 2012 Annual Report Download - page 34
Download and view the complete annual report
Please find page 34 of the 2012 Bank of America annual report below. You can navigate through the pages in the report by either clicking on the pages listed below, or by using the keyword search tool below to find specific information within the annual report.-
 1
1 -
2
-
3
-
4
-
5
-
6
-
7
-
8
-
9
-
10
-
11
-
12
-
13
-
14
-
15
-
16
-
17
-
18
-
19
-
20
-
21
-
22
-
23
-
 24
24 -
 25
25 -
 26
26 -
 27
27 -
 28
28 -
 29
29 -
 30
30 -
 31
31 -
 32
32 -
 33
33 -
 34
34 -
 35
35 -
 36
36 -
 37
37 -
 38
38 -
 39
39 -
 40
40 -
 41
41 -
 42
42 -
 43
43 -
 44
44 -
45
-
46
-
47
-
48
-
49
-
50
-
51
-
52
-
53
-
54
-
55
-
56
-
57
-
58
-
59
-
60
-
61
-
62
-
63
-
64
-
65
-
66
-
67
-
68
-
69
-
70
-
71
-
72
-
73
-
74
-
75
-
76
-
77
-
78
-
79
-
80
-
81
-
82
-
83
-
84
-
85
-
86
-
87
-
88
-
89
-
90
-
91
-
92
-
93
-
94
-
95
-
96
-
97
-
98
-
99
-
100
-
101
-
102
-
103
-
104
-
105
-
106
-
107
-
108
-
109
-
110
-
111
-
112
-
113
-
114
-
115
-
116
-
117
-
118
-
119
-
120
-
121
-
122
-
123
-
124
-
125
-
126
-
127
-
128
-
129
-
130
-
131
-
132
-
133
-
134
-
135
-
136
-
137
-
138
-
139
-
140
-
141
-
142
-
143
-
144
-
145
-
146
-
147
-
148
-
149
-
150
-
151
-
152
-
153
-
154
-
155
-
156
-
157
-
158
-
159
-
160
-
161
-
162
-
163
-
164
-
165
-
166
-
167
-
168
-
169
-
170
-
171
-
172
-
173
-
174
-
175
-
176
-
177
-
178
-
179
-
180
-
181
-
182
-
183
-
184
-
185
-
186
-
187
-
188
-
189
-
190
-
191
-
192
-
193
-
194
-
195
-
196
-
197
-
198
-
199
-
200
-
201
-
202
-
203
-
204
-
205
-
206
-
207
-
208
-
209
-
210
-
211
-
212
-
213
-
214
-
215
-
216
-
217
-
218
-
219
-
220
-
221
-
222
-
223
-
224
-
225
-
226
-
227
-
228
-
229
-
230
-
231
-
232
-
233
-
234
-
235
-
236
-
237
-
238
-
239
-
240
-
241
-
242
-
243
-
244
-
245
-
246
-
247
-
248
-
249
-
250
-
251
-
252
-
253
-
254
-
255
-
256
-
257
-
258
-
259
-
260
-
261
-
262
-
263
-
264
-
265
-
266
-
267
-
268
-
269
-
270
-
271
-
272
-
273
-
274
-
275
-
276
-
277
-
278
-
279
-
280
-
281
-
282
-
283
-
284
 |
 |

32 Bank of America 2012
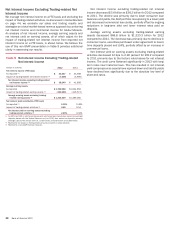
Net Interest Income Excluding Trading-related Net
Interest Income
We manage net interest income on a FTE basis and excluding the
impact of trading-related activities. As discussed in Global Markets
on page 44, we evaluate our sales and trading results and
strategies on a total market-based revenue approach by combining
net interest income and noninterest income for Global Markets.
An analysis of net interest income, average earning assets and
net interest yield on earning assets, all of which adjust for the
impact of trading-related net interest income from reported net
interest income on a FTE basis, is shown below. We believe the
use of this non-GAAP presentation in Table 9 provides additional
clarity in assessing our results.
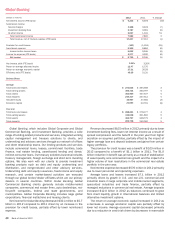
Table 9 Net Interest Income Excluding Trading-related
Net Interest Income
(Dollars in millions) 2012 2011
Net interest income (FTE basis)
As reported (1) $ 41,557 $ 45,588
Impact of trading-related net interest income (2) (3,308) (3,690)
Net interest income excluding trading-related
net interest income (3) $ 38,249 $ 41,898
Average earning assets
As reported $ 1,769,969 $1,834,659
Impact of trading-related earning assets (2) (449,660) (445,574)
Average earning assets excluding trading-
related earning assets (3) $ 1,320,309 $1,389,085
Net interest yield contribution (FTE basis)
As reported (1) 2.35% 2.48%
Impact of trading-related activities (2) 0.55 0.54
Net interest yield on earning assets excluding
trading-related activities (3) 2.90% 3.02%
(1) For 2012 and 2011, net interest income and net interest yield include fees earned on overnight
deposits placed with the Federal Reserve and, for 2012, fees earned on deposits, primarily
overnight, placed with certain non-U.S. central banks, of $189 million and $186 million.
(2) Represents the impact of trading-related amounts included in Global Markets.
(3) Represents a non-GAAP financial measure.
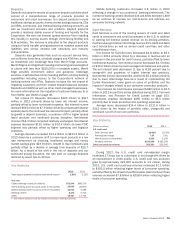
Net interest income excluding trading-related net interest
income decreased $3.6 billion to $38.2 billion for 2012 compared
to 2011. The decline was primarily due to lower consumer loan
balances and yields, the ALM portfolio recouponing to a lower yield
and decreased commercial loan yields, partially offset by ongoing
reductions in long-term debt and lower interest rates paid on
deposits.
Average earning assets excluding trading-related earning
assets decreased $68.8 billion to $1,320.3 billion for 2012
compared to 2011. The decrease was primarily due to declines in
consumer loans, securities purchased under agreement to resell,
time deposits placed and LHFS, partially offset by an increase in
commercial loans.
Net interest yield on earning assets excluding trading-related
activities decreased 12 bps to 2.90 percent for 2012 compared
to 2011 primarily due to the factors noted above for net interest
income. The yield curve flattened significantly in 2012 with long-
term rates near historical lows. This has resulted in net interest
yield compression as assets have repriced down and liability yields
have declined less significantly due to the absolute low level of
short-end rates.