Bank of America 2012 Annual Report Download - page 88
Download and view the complete annual report
Please find page 88 of the 2012 Bank of America annual report below. You can navigate through the pages in the report by either clicking on the pages listed below, or by using the keyword search tool below to find specific information within the annual report.-
 1
1 -
2
-
3
-
4
-
5
-
6
-
7
-
8
-
9
-
10
-
11
-
12
-
13
-
14
-
15
-
16
-
17
-
18
-
19
-
20
-
21
-
22
-
23
-
24
-
25
-
26
-
27
-
28
-
29
-
30
-
31
-
32
-
33
-
34
-
35
-
36
-
37
-
38
-
39
-
40
-
41
-
42
-
43
-
44
-
45
-
46
-
47
-
48
-
49
-
50
-
51
-
52
-
53
-
54
-
55
-
56
-
57
-
58
-
59
-
60
-
61
-
62
-
63
-
64
-
65
-
66
-
67
-
68
-
69
-
70
-
71
-
72
-
73
-
74
-
75
-
76
-
77
-
 78
78 -
 79
79 -
 80
80 -
 81
81 -
 82
82 -
 83
83 -
 84
84 -
 85
85 -
 86
86 -
 87
87 -
 88
88 -
 89
89 -
 90
90 -
 91
91 -
 92
92 -
 93
93 -
 94
94 -
 95
95 -
 96
96 -
 97
97 -
 98
98 -
99
-
100
-
101
-
102
-
103
-
104
-
105
-
106
-
107
-
108
-
109
-
110
-
111
-
112
-
113
-
114
-
115
-
116
-
117
-
118
-
119
-
120
-
121
-
122
-
123
-
124
-
125
-
126
-
127
-
128
-
129
-
130
-
131
-
132
-
133
-
134
-
135
-
136
-
137
-
138
-
139
-
140
-
141
-
142
-
143
-
144
-
145
-
146
-
147
-
148
-
149
-
150
-
151
-
152
-
153
-
154
-
155
-
156
-
157
-
158
-
159
-
160
-
161
-
162
-
163
-
164
-
165
-
166
-
167
-
168
-
169
-
170
-
171
-
172
-
173
-
174
-
175
-
176
-
177
-
178
-
179
-
180
-
181
-
182
-
183
-
184
-
185
-
186
-
187
-
188
-
189
-
190
-
191
-
192
-
193
-
194
-
195
-
196
-
197
-
198
-
199
-
200
-
201
-
202
-
203
-
204
-
205
-
206
-
207
-
208
-
209
-
210
-
211
-
212
-
213
-
214
-
215
-
216
-
217
-
218
-
219
-
220
-
221
-
222
-
223
-
224
-
225
-
226
-
227
-
228
-
229
-
230
-
231
-
232
-
233
-
234
-
235
-
236
-
237
-
238
-
239
-
240
-
241
-
242
-
243
-
244
-
245
-
246
-
247
-
248
-
249
-
250
-
251
-
252
-
253
-
254
-
255
-
256
-
257
-
258
-
259
-
260
-
261
-
262
-
263
-
264
-
265
-
266
-
267
-
268
-
269
-
270
-
271
-
272
-
273
-
274
-
275
-
276
-
277
-
278
-
279
-
280
-
281
-
282
-
283
-
284
 |
 |

86 Bank of America 2012
Countrywide Purchased Credit-impaired Loan Portfolio
Loans acquired with evidence of credit quality deterioration since
origination and for which it is probable at purchase that we will be
unable to collect all contractually required payments are accounted
for under the accounting guidance for PCI loans, which addresses
accounting for differences between contractual and expected cash
flows to be collected from the purchaser’s initial investment in
loans if those differences are attributable, at least in part, to credit
quality. Evidence of credit quality deterioration as of the acquisition
date may include statistics such as past due status, refreshed
FICO scores and refreshed LTVs. PCI loans are recorded at fair
value upon acquisition and the applicable accounting guidance
prohibits carrying over or recording a valuation allowance in the
initial accounting.
PCI loans that have similar risk characteristics, primarily credit
risk, collateral type and interest rate risk, are pooled and accounted
for as a single asset with a single composite interest rate and an
aggregate expectation of cash flows. Once a pool is assembled,
it is considered as if it were one loan for purposes of applying the
accounting guidance for PCI loans. An individual loan is removed
from a PCI loan pool if it is sold, foreclosed, forgiven or the
expectation of any future proceeds is remote. When a loan is
removed from a PCI loan pool and the foreclosure or recovery value
of the loan is less than the loan’s carrying value, the difference is
first applied against the PCI pool’s nonaccretable difference. If the
nonaccretable difference has been fully utilized, only then is the
PCI pool’s basis applicable to that loan written-off against its
valuation reserve; however, the integrity of the pool is maintained
and it continues to be accounted for as if it were one loan.
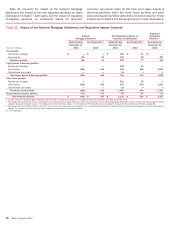
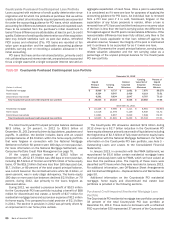
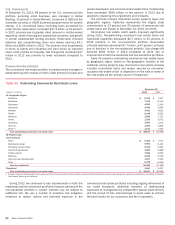
Table 29 presents the unpaid principal balance, carrying value,
related valuation allowance and the net carrying value as a
percentage of the unpaid principal balance for the Countrywide
PCI loan portfolio.
Table 29 Countrywide Purchased Credit-impaired Loan Portfolio
December 31, 2012
(Dollars in millions)
Unpaid
Principal
Balance
Carrying
Value
Related
Valuation
Allowance
Carrying
Value Net of
Valuation
Allowance
Percent of
Unpaid
Principal
Balance
Residential mortgage $ 8,898 $ 8,737 $ 1,061 $ 7,676 86.27%
Home equity 8,324 8,547 2,428 6,119 73.51
Discontinued real estate 9,281 8,834 2,047 6,787 73.13
Total Countrywide purchased credit-impaired loan portfolio $ 26,503 $ 26,118 $ 5,536 $ 20,582 77.66
December 31, 2011
Residential mortgage $ 10,426 $ 9,966 $ 1,111 $ 8,855 84.93%
Home equity 12,516 11,978 5,129 6,849 54.72
Discontinued real estate 11,891 9,857 2,219 7,638 64.23
Total Countrywide purchased credit-impaired loan portfolio $ 34,833 $ 31,801 $ 8,459 $ 23,342 67.01
The total Countrywide PCI unpaid principal balance decreased
$8.3 billion, or 24 percent, in 2012 to $26.5 billion at
December 31, 2012 primarily driven by liquidations, paydowns and
payoffs. In addition, the decline includes loans with an unpaid
principal balance of $2.9 billion within the home equity portfolio
that were forgiven in connection with the National Mortgage
Settlement of which 92 percent were 180 days or more past due.
For more information on the National Mortgage Settlement, see
Consumer Portfolio Credit Risk Management on page 76.
Of the unpaid principal balance of $26.5 billion at
December 31, 2012, $7.3 billion was 180 days or more past due,
including $6.5 billion of first-lien and $795 million of home equity
loans. Of the $19.2 billion that was less than 180 days past due,
$17.1 billion, or 89 percent of the total unpaid principal balance,
was current based on the contractual terms while $1.3 billion, or
seven percent, was in early stage delinquency. The home equity
180 days or more past due balances declined $2.9 billion, or 79
percent, during 2012, due primarily to the loans forgiven as
discussed above.
During 2012, we recorded a provision benefit of $103 million
for the Countrywide PCI loan portfolio including a benefit of $88
million for discontinued real estate, a benefit of $27 million for
residential mortgage loans and a provision expense of $12 million
for home equity. This compared to a total provision of $2.1 billion
in 2011. The decline in provision in 2012 was primarily driven by
an improvement in our home price outlook.
The Countrywide PCI allowance declined $2.9 billion during
2012 driven by a $2.7 billion reduction in the Countrywide PCI
home equity allowance primarily as a result of liquidations including
the forgiveness of $2.5 billion of fully reserved home equity loans
in connection with the National Mortgage Settlement. For further
information on the Countrywide PCI loan portfolio, see Note 5 –
Outstanding Loans and Leases to the Consolidated Financial
Statements.
In January 2013, in connection with the FNMA Settlement, we
repurchased for $6.6 billion certain residential mortgage loans
that had previously been sold to FNMA, which we have valued at
less than the purchase price. The majority of these loans were
classified as PCI loans when they were recorded in January 2013.
For additional information, see Off-Balance Sheet Arrangements
and Contractual Obligations – Representations and Warranties on
page 50.
Additional information on the Countrywide PCI residential
mortgage, home equity and discontinued real estate loan
portfolios is provided in the following sections.
Purchased Credit-impaired Residential Mortgage Loan
Portfolio
The Countrywide PCI residential mortgage loan portfolio comprised
33 percent of the total Countrywide PCI loan portfolio at
December 31, 2012. Those loans to borrowers with a refreshed
FICO score below 620 represented 37 percent of the Countrywide