Bank of America 2012 Annual Report Download - page 99
Download and view the complete annual report
Please find page 99 of the 2012 Bank of America annual report below. You can navigate through the pages in the report by either clicking on the pages listed below, or by using the keyword search tool below to find specific information within the annual report.-
 1
1 -
2
-
3
-
4
-
5
-
6
-
7
-
8
-
9
-
10
-
11
-
12
-
13
-
14
-
15
-
16
-
17
-
18
-
19
-
20
-
21
-
22
-
23
-
24
-
25
-
26
-
27
-
28
-
29
-
30
-
31
-
32
-
33
-
34
-
35
-
36
-
37
-
38
-
39
-
40
-
41
-
42
-
43
-
44
-
45
-
46
-
47
-
48
-
49
-
50
-
51
-
52
-
53
-
54
-
55
-
56
-
57
-
58
-
59
-
60
-
61
-
62
-
63
-
64
-
65
-
66
-
67
-
68
-
69
-
70
-
71
-
72
-
73
-
74
-
75
-
76
-
77
-
78
-
79
-
80
-
81
-
82
-
83
-
84
-
85
-
86
-
87
-
88
-
 89
89 -
 90
90 -
 91
91 -
 92
92 -
 93
93 -
 94
94 -
 95
95 -
 96
96 -
 97
97 -
 98
98 -
 99
99 -
 100
100 -
 101
101 -
 102
102 -
 103
103 -
 104
104 -
 105
105 -
 106
106 -
 107
107 -
 108
108 -
 109
109 -
110
-
111
-
112
-
113
-
114
-
115
-
116
-
117
-
118
-
119
-
120
-
121
-
122
-
123
-
124
-
125
-
126
-
127
-
128
-
129
-
130
-
131
-
132
-
133
-
134
-
135
-
136
-
137
-
138
-
139
-
140
-
141
-
142
-
143
-
144
-
145
-
146
-
147
-
148
-
149
-
150
-
151
-
152
-
153
-
154
-
155
-
156
-
157
-
158
-
159
-
160
-
161
-
162
-
163
-
164
-
165
-
166
-
167
-
168
-
169
-
170
-
171
-
172
-
173
-
174
-
175
-
176
-
177
-
178
-
179
-
180
-
181
-
182
-
183
-
184
-
185
-
186
-
187
-
188
-
189
-
190
-
191
-
192
-
193
-
194
-
195
-
196
-
197
-
198
-
199
-
200
-
201
-
202
-
203
-
204
-
205
-
206
-
207
-
208
-
209
-
210
-
211
-
212
-
213
-
214
-
215
-
216
-
217
-
218
-
219
-
220
-
221
-
222
-
223
-
224
-
225
-
226
-
227
-
228
-
229
-
230
-
231
-
232
-
233
-
234
-
235
-
236
-
237
-
238
-
239
-
240
-
241
-
242
-
243
-
244
-
245
-
246
-
247
-
248
-
249
-
250
-
251
-
252
-
253
-
254
-
255
-
256
-
257
-
258
-
259
-
260
-
261
-
262
-
263
-
264
-
265
-
266
-
267
-
268
-
269
-
270
-
271
-
272
-
273
-
274
-
275
-
276
-
277
-
278
-
279
-
280
-
281
-
282
-
283
-
284
 |
 |

Bank of America 2012 97
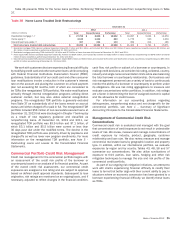
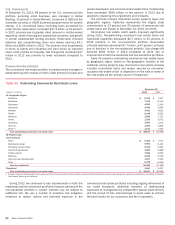
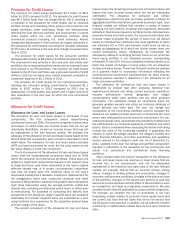
Nonperforming Commercial Loans, Leases and
Foreclosed Properties Activity
Table 46 presents the nonperforming commercial loans, leases
and foreclosed properties activity during 2012 and 2011.
Nonperforming commercial loans and leases decreased $3.1
billion to $3.2 billion at December 31, 2012 driven by paydowns,
charge-offs and sales outpacing new nonperforming loans.
Approximately 94 percent of commercial nonperforming loans,
leases and foreclosed properties are secured and approximately
45 percent are contractually current. Commercial nonperforming
loans are carried at approximately 76 percent of their unpaid
principal balance before consideration of the allowance for loan
and lease losses as the carrying value of these loans has been
reduced to the estimated property value less estimated costs to
sell.
Table 46 Nonperforming Commercial Loans, Leases and Foreclosed Properties Activity (1, 2)
(Dollars in millions) 2012 2011
Nonperforming loans and leases, January 1 $ 6,337 $9,836
Additions to nonperforming loans and leases:
New nonperforming loans and leases 2,334 4,656
Advances 85 157
Reductions to nonperforming loans and leases:
Paydowns (2,372)(3,457)
Sales (840)(1,153)
Returns to performing status (3) (808)(1,183)
Charge-offs (4) (1,164)(1,576)
Transfers to foreclosed properties (5) (302)(774)
Transfers to loans held-for-sale (46) (169)
Total net reductions to nonperforming loans and leases (3,113)(3,499)
Total nonperforming loans and leases, December 31 3,224 6,337
Foreclosed properties, January 1 612 725
Additions to foreclosed properties:
New foreclosed properties (5) 222 507
Reductions to foreclosed properties:
Sales (516)(539)
Write-downs (68) (81)
Total net reductions to foreclosed properties (362)(113)
Total foreclosed properties, December 31 250 612
Nonperforming commercial loans, leases and foreclosed properties, December 31 $ 3,474 $6,949
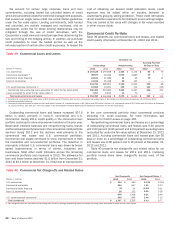
Nonperforming commercial loans and leases as a percentage of outstanding commercial loans and leases (6) 0.93%2.04%
Nonperforming commercial loans, leases and foreclosed properties as a percentage of outstanding commercial loans, leases and
foreclosed properties (6) 1.00 2.24
(1) Balances do not include nonperforming LHFS of $437 million and $1.1 billion at December 31, 2012 and 2011.
(2) Includes U.S. small business commercial activity.
(3) Commercial loans and leases may be returned to performing status when all principal and interest is current and full repayment of the remaining contractual principal and interest is expected or
when the loan otherwise becomes well-secured and is in the process of collection. TDRs are generally classified as performing after a sustained period of demonstrated payment performance.
(4) Small business card loans are not classified as nonperforming; therefore, the charge-offs on these loans have no impact on nonperforming activity and accordingly are excluded from this table.
(5) New foreclosed properties represents transfers of nonperforming loans to foreclosed properties net of charge-offs recorded during the first 90 days after transfer of a loan to foreclosed properties.
(6) Excludes loans accounted for under the fair value option.
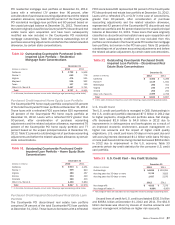
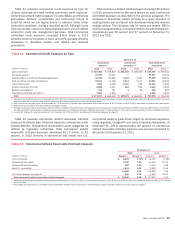
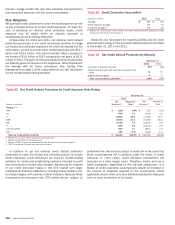
Table 47 presents our commercial TDRs by product type and
performing status. U.S. small business commercial TDRs are
comprised of renegotiated small business card loans and are not
classified as nonperforming as they are charged off no later than
the end of the month in which the loan becomes 180 days past
due. For additional information on TDRs, see Note 5 – Outstanding
Loans and Leases to the Consolidated Financial Statements.
Table 47 Commercial Troubled Debt Restructurings
December 31
2012 2011
(Dollars in millions) Total Nonperforming Performing Total Nonperforming Performing
U.S. commercial $ 1,328 $ 565 $763 $ 1,329 $ 531 $ 798
Commercial real estate 1,391 740 651 1,675 1,076 599
Non-U.S. commercial 100 15 85 54 38 16
U.S. small business commercial 202 — 202 389 — 389
Total commercial troubled debt restructurings $ 3,021 $ 1,320 $ 1,701 $ 3,447 $ 1,645 $ 1,802