Bank of America 2012 Annual Report Download - page 74
Download and view the complete annual report
Please find page 74 of the 2012 Bank of America annual report below. You can navigate through the pages in the report by either clicking on the pages listed below, or by using the keyword search tool below to find specific information within the annual report.-
 1
1 -
2
-
3
-
4
-
5
-
6
-
7
-
8
-
9
-
10
-
11
-
12
-
13
-
14
-
15
-
16
-
17
-
18
-
19
-
20
-
21
-
22
-
23
-
24
-
25
-
26
-
27
-
28
-
29
-
30
-
31
-
32
-
33
-
34
-
35
-
36
-
37
-
38
-
39
-
40
-
41
-
42
-
43
-
44
-
45
-
46
-
47
-
48
-
49
-
50
-
51
-
52
-
53
-
54
-
55
-
56
-
57
-
58
-
59
-
60
-
61
-
62
-
63
-
 64
64 -
 65
65 -
 66
66 -
 67
67 -
 68
68 -
 69
69 -
 70
70 -
 71
71 -
 72
72 -
 73
73 -
 74
74 -
 75
75 -
 76
76 -
 77
77 -
 78
78 -
 79
79 -
 80
80 -
 81
81 -
 82
82 -
 83
83 -
 84
84 -
85
-
86
-
87
-
88
-
89
-
90
-
91
-
92
-
93
-
94
-
95
-
96
-
97
-
98
-
99
-
100
-
101
-
102
-
103
-
104
-
105
-
106
-
107
-
108
-
109
-
110
-
111
-
112
-
113
-
114
-
115
-
116
-
117
-
118
-
119
-
120
-
121
-
122
-
123
-
124
-
125
-
126
-
127
-
128
-
129
-
130
-
131
-
132
-
133
-
134
-
135
-
136
-
137
-
138
-
139
-
140
-
141
-
142
-
143
-
144
-
145
-
146
-
147
-
148
-
149
-
150
-
151
-
152
-
153
-
154
-
155
-
156
-
157
-
158
-
159
-
160
-
161
-
162
-
163
-
164
-
165
-
166
-
167
-
168
-
169
-
170
-
171
-
172
-
173
-
174
-
175
-
176
-
177
-
178
-
179
-
180
-
181
-
182
-
183
-
184
-
185
-
186
-
187
-
188
-
189
-
190
-
191
-
192
-
193
-
194
-
195
-
196
-
197
-
198
-
199
-
200
-
201
-
202
-
203
-
204
-
205
-
206
-
207
-
208
-
209
-
210
-
211
-
212
-
213
-
214
-
215
-
216
-
217
-
218
-
219
-
220
-
221
-
222
-
223
-
224
-
225
-
226
-
227
-
228
-
229
-
230
-
231
-
232
-
233
-
234
-
235
-
236
-
237
-
238
-
239
-
240
-
241
-
242
-
243
-
244
-
245
-
246
-
247
-
248
-
249
-
250
-
251
-
252
-
253
-
254
-
255
-
256
-
257
-
258
-
259
-
260
-
261
-
262
-
263
-
264
-
265
-
266
-
267
-
268
-
269
-
270
-
271
-
272
-
273
-
274
-
275
-
276
-
277
-
278
-
279
-
280
-
281
-
282
-
283
-
284
 |
 |

72 Bank of America 2012
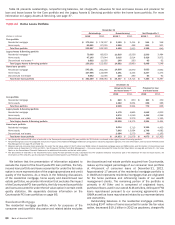
eligible assets was approximately $194 billion and $189 billion
at December 31, 2012 and 2011. We have established
operational procedures to enable us to borrow against these
assets, including regularly monitoring our total pool of eligible
loans and securities collateral. Eligibility is defined by guidelines
outlined by the FHLBs and the Federal Reserve and is subject to
change at their discretion. Due to regulatory restrictions, liquidity
generated by the bank subsidiaries can only be used to fund
obligations within the bank subsidiaries and can only be
transferred to the parent company or nonbank subsidiaries with
prior regulatory approval.
Global Excess Liquidity Sources available to our broker/dealer
subsidiaries totaled $22 billion and $31 billion at December 31,
2012 and 2011. Our broker/dealers also held other
unencumbered investment-grade securities and equities that we
believe could also be used to generate additional liquidity. Liquidity
held in a broker/dealer subsidiary is available to meet the
obligations of that entity and can only be transferred to the parent
company or to any other subsidiary with prior regulatory approval
due to regulatory restrictions and minimum requirements.
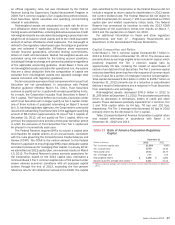
Table 18 presents the composition of Global Excess Liquidity
Sources at December 31, 2012 and 2011.
Table 18 Global Excess Liquidity Sources Composition
December 31
(Dollars in billions) 2012 2011
Cash on deposit $ 65 $ 79
U.S. treasuries 21 48
U.S. agency securities and mortgage-backed securities 271 228
Non-U.S. government and supranational securities 15 23
Total global excess liquidity sources $ 372 $ 378
Time to Required Funding and Stress Modeling
We use a variety of metrics to determine the appropriate amounts
of excess liquidity to maintain at the parent company and our bank
and broker/dealer subsidiaries. One metric we use to evaluate the
appropriate level of excess liquidity at the parent company is “Time
to Required Funding.” This debt coverage measure indicates the
number of months that the parent company can continue to meet
its unsecured contractual obligations as they come due using only
its Global Excess Liquidity Sources without issuing any new debt
or accessing any additional liquidity sources. We define unsecured
contractual obligations for purposes of this metric as maturities
of senior or subordinated debt issued or guaranteed by Bank of
America Corporation or Merrill Lynch. These include certain
unsecured debt instruments, primarily structured liabilities, which
we may be required to settle for cash prior to maturity. The
Corporation has established a target for Time to Required Funding
of 21 months. Our Time to Required Funding was 33 months at
December 31, 2012. For purposes of calculating Time to Required
Funding at December 31, 2012, we have also included in the
amount of unsecured contractual obligations the $8.6 billion
liability related to the BNY Mellon Settlement. The BNY Mellon
Settlement is subject to final court approval and certain other
conditions, and the timing of payment is not certain.
We utilize liquidity stress models to assist us in determining
the appropriate amounts of excess liquidity to maintain at the
parent company and our bank and broker/dealer subsidiaries.
These models are risk sensitive and have become increasingly
important in analyzing our potential contractual and contingent
cash outflows beyond those outflows considered in the Time to
Required Funding analysis. We evaluate the liquidity requirements
under a range of scenarios with varying levels of severity and time
horizons. The scenarios we consider and utilize incorporate
market-wide and Corporation-specific events, including potential
credit rating downgrades for the parent company and our
subsidiaries, and are based on historical experience, regulatory
guidance, and both expected and unexpected future events.
The types of potential contractual and contingent cash outflows
we consider in our scenarios may include, but are not limited to,
upcoming contractual maturities of unsecured debt and reductions
in new debt issuance; diminished access to secured financing
markets; potential deposit withdrawals and reduced rollover of
maturing term deposits by customers; increased draws on loan
commitments, liquidity facilities and letters of credit, including
Variable Rate Demand Notes; additional collateral that
counterparties could call if our credit ratings were downgraded
further; collateral, margin and subsidiary capital requirements
arising from losses; and potential liquidity required to maintain
businesses and finance customer activities. Changes in certain
market factors, including, but not limited to, credit rating
downgrades, could negatively impact potential contractual and
contingent outflows and the related financial instruments, and in
some cases these impacts could be material to our financial
results.
We consider all sources of funds that we could access during
each stress scenario and focus particularly on matching available
sources with corresponding liquidity requirements by legal entity.
We also use the stress modeling results to manage our asset-
liability profile and establish limits and guidelines on certain
funding sources and businesses.
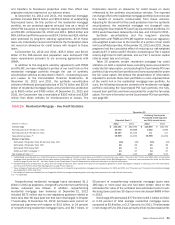
Basel 3 Liquidity Standards
In December 2010, the Basel Committee proposed two measures
of liquidity risk which are considered part of Basel 3. The first
proposed liquidity measure is the Liquidity Coverage Ratio (LCR),
which is calculated as the amount of a financial institution’s
unencumbered, high-quality, liquid assets relative to the net cash
outflows the institution could encounter under a significant 30-day
stress scenario. The Basel Committee announced in January 2013
that an initial minimum LCR requirement of 60 percent will be
implemented in January 2015, and will thereafter increase in 10
percent annual increments through January 2019. The second
proposed liquidity measure is the Net Stable Funding Ratio (NSFR),
which measures the amount of longer-term, stable sources of
funding employed by a financial institution relative to the liquidity
profiles of the assets funded and the potential for contingent calls
on funding liquidity arising from off-balance sheet commitments
and obligations over a one-year period. The Basel Committee is
currently reviewing the NSFR requirement and intends for the
requirement to be implemented by January 2018, following an
observation period that is currently underway. We continue to
monitor the development and the potential impact of these
proposals and assuming adoption by U.S. banking regulators, we
expect to meet the final standards within the regulatory timelines.