Bank of America 2010 Annual Report Download - page 100
Download and view the complete annual report
Please find page 100 of the 2010 Bank of America annual report below. You can navigate through the pages in the report by either clicking on the pages listed below, or by using the keyword search tool below to find specific information within the annual report.-
 1
1 -
2
-
3
-
4
-
5
-
6
-
7
-
8
-
9
-
10
-
11
-
12
-
13
-
14
-
15
-
16
-
17
-
18
-
19
-
20
-
21
-
22
-
23
-
24
-
25
-
26
-
27
-
28
-
29
-
30
-
31
-
32
-
33
-
34
-
35
-
36
-
37
-
38
-
39
-
40
-
41
-
42
-
43
-
44
-
45
-
46
-
47
-
48
-
49
-
50
-
51
-
52
-
53
-
54
-
55
-
56
-
57
-
58
-
59
-
60
-
61
-
62
-
63
-
64
-
65
-
66
-
67
-
68
-
69
-
70
-
71
-
72
-
73
-
74
-
75
-
76
-
77
-
78
-
79
-
80
-
81
-
82
-
83
-
84
-
85
-
86
-
87
-
88
-
89
-
 90
90 -
 91
91 -
 92
92 -
 93
93 -
 94
94 -
 95
95 -
 96
96 -
 97
97 -
 98
98 -
 99
99 -
 100
100 -
 101
101 -
 102
102 -
 103
103 -
 104
104 -
 105
105 -
 106
106 -
 107
107 -
 108
108 -
 109
109 -
 110
110 -
111
-
112
-
113
-
114
-
115
-
116
-
117
-
118
-
119
-
120
-
121
-
122
-
123
-
124
-
125
-
126
-
127
-
128
-
129
-
130
-
131
-
132
-
133
-
134
-
135
-
136
-
137
-
138
-
139
-
140
-
141
-
142
-
143
-
144
-
145
-
146
-
147
-
148
-
149
-
150
-
151
-
152
-
153
-
154
-
155
-
156
-
157
-
158
-
159
-
160
-
161
-
162
-
163
-
164
-
165
-
166
-
167
-
168
-
169
-
170
-
171
-
172
-
173
-
174
-
175
-
176
-
177
-
178
-
179
-
180
-
181
-
182
-
183
-
184
-
185
-
186
-
187
-
188
-
189
-
190
-
191
-
192
-
193
-
194
-
195
-
196
-
197
-
198
-
199
-
200
-
201
-
202
-
203
-
204
-
205
-
206
-
207
-
208
-
209
-
210
-
211
-
212
-
213
-
214
-
215
-
216
-
217
-
218
-
219
-
220
-
221
-
222
-
223
-
224
-
225
-
226
-
227
-
228
-
229
-
230
-
231
-
232
-
233
-
234
-
235
-
236
-
237
-
238
-
239
-
240
-
241
-
242
-
243
-
244
-
245
-
246
-
247
-
248
-
249
-
250
-
251
-
252
 |
 |

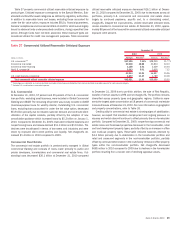
Non-U.S. Portfolio
Our non-U.S. credit and trading portfolios are subject to country risk. We
define country risk as the risk of loss from unfavorable economic and political
conditions, currency fluctuations, social instability and changes in govern-
ment policies. A risk management framework is in place to measure, monitor
and manage non-U.S. risk and exposures. Management oversight of country
risk, including cross-border risk, is provided by the Regional Risk Committee, a
subcommittee of the CRC.
The following table sets forth total non-U.S. exposure broken out by region
at December 31, 2010 and 2009. Non-U.S. exposure includes credit
exposure net of local liabilities, securities and other investments issued by
or domiciled in countries other than the U.S. Total non-U.S. exposure can be
adjusted for externally guaranteed loans outstanding and certain collateral
types. Exposures which are subject to external guarantees are reported under
the country of the guarantor. Exposures with tangible collateral are reflected in
the country where the collateral is held. For securities received, other than
cross-border resale agreements, outstandings are assigned to the domicile of
the issuer of the securities. Resale agreements are generally presented
based on the domicile of the counterparty consistent with FFIEC reporting
requirements.
Table 46 Regional Non-U.S. Exposure
(1,2,3)
(Dollars in millions)
2010 2009
December 31
Europe
$148,078
$170,796
Asia Pacific
73,255
47,645
Latin America
14,848
19,516
Middle East and Africa
3,688
3,906
Other
22,188
15,799
Total
$262,057
$257,662
(1)
Local funding or liabilities are subtracted from local exposures consistent with FFIEC reporting requirements.
(2)
Derivative assets included in the exposure amounts have been reduced by the amount of cash collateral applied of $44.2 billion and $34.3 billion at December 31, 2010 and 2009.
(3)
Generally, resale agreements are presented based on the domicile of the counterparty, consistent with FFIEC reporting requirements. Cross-border resale agreements where the underlying securities are U.S. Treasury securities, in
which case the domicile is the U.S., are excluded from this presentation.
Our total non-U.S. exposure was $262.1 billion at December 31, 2010, an
increase of $4.4 billion from December 31, 2009. Our non-U.S. exposure
remained concentrated in Europe which accounted for $148.1 billion, or
57 percent, of total non-U.S. exposure. The European exposure was mostly
in Western Europe and was distributed across a variety of industries. The
decrease of $22.7 billion in Europe was primarily driven by our efforts to
reduce exposure in the peripheral Eurozone countries and sale or maturity of
securities in the U.K. Select European countries are further detailed in Table
49. Asia Pacific was our second largest non-U.S. exposure at $73.3 billion, or
28 percent. The $25.6 billion increase in Asia Pacific was predominantly
driven by a required change in accounting for our CCB investment, increased
securities exposure in Japan, and increased securities and loan exposure in
other Asia Pacific emerging markets. For more information on the required
change in accounting for our CCB investment, refer to Note 5 – Securities to
the Consolidated Financial Statements. Latin America accounted for $14.8 bil-
lion, or six percent, of total non-U.S. exposure. The $4.7 billion decrease in
Latin America was primarily driven by the sale of our equity investments in Itaú
Unibanco and Santander. Other non-U.S. exposure was $22.2 billion at
December 31, 2010, an increase of $6.4 billion from the prior year resulting
from an increase in Canadian cross-border loans. For more information on our
Asia Pacific and Latin America exposure, see non-U.S. exposure to selected
countries defined as emerging markets on page 99.
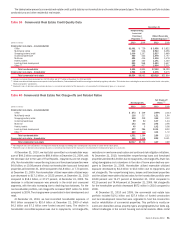
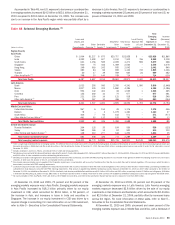
As shown in Table 47, the United Kingdom, France and China had total
cross-border exposure greater than one percent of our total assets and were
the only countries where total cross-border exposure exceeded one percent of
our total assets at December 31, 2010. At December 31, 2010, Canada and
Japan had total cross-border exposure of $17.9 billion and $17.0 billion
representing 0.79 percent and 0.75 percent of total assets. Canada and
Japan were the only other countries that had total cross-border exposure that
exceeded 0.75 percent of our total assets at December 31, 2010.
Exposure includes cross-border claims by our non-U.S. offices including
loans, acceptances, time deposits placed, trading account assets, securities,
derivative assets, other interest-earning investments and other monetary
assets. Amounts also include unused commitments, SBLCs, commercial
letters of credit and formal guarantees. Sector definitions are consistent with
FFIEC reporting requirements for preparing the Country Exposure Report.
Table 47 Total Cross-border Exposure Exceeding One Percent of Total Assets
(1)
(Dollars in millions)
December 31 Public Sector Banks Private Sector
Cross-border
Exposure
Exposure as a
Percentage of
Total Assets
United Kingdom
2010 $101 $ 5,544 $32,354 $37,999 1.68%
2009 157 8,478 52,080 60,715 2.73
France
(2)
2010 978 8,110 15,685 24,773 1.09
China
(2)
2010 777 21,617 1,534 23,928 1.06
(1)
At December 31, 2010, total cross-border exposure for the United Kingdom, France and China included derivatives exposure of $2.3 billion, $1.7 billion and $870 million, respectively, which has been reduced by the amount of cash
collateral applied of $13.0 billion, $6.9 billion and $130 million, respectively. Derivative assets were collateralized by other marketable securities of $96 million, $26 million and $71 million, respectively, at December 31, 2010.
(2)
At December 31, 2009, total cross-border exposure for France and China was $17.4 billion and $12.1 billion, representing 0.78 percent and 0.54 percent of total assets.
98 Bank of America 2010