Bank of America 2010 Annual Report Download - page 44
Download and view the complete annual report
Please find page 44 of the 2010 Bank of America annual report below. You can navigate through the pages in the report by either clicking on the pages listed below, or by using the keyword search tool below to find specific information within the annual report.-
 1
1 -
2
-
3
-
4
-
5
-
6
-
7
-
8
-
9
-
10
-
11
-
12
-
13
-
14
-
15
-
16
-
17
-
18
-
19
-
20
-
21
-
22
-
23
-
24
-
25
-
26
-
27
-
28
-
29
-
30
-
31
-
32
-
33
-
 34
34 -
 35
35 -
 36
36 -
 37
37 -
 38
38 -
 39
39 -
 40
40 -
 41
41 -
 42
42 -
 43
43 -
 44
44 -
 45
45 -
 46
46 -
 47
47 -
 48
48 -
 49
49 -
 50
50 -
 51
51 -
 52
52 -
 53
53 -
 54
54 -
55
-
56
-
57
-
58
-
59
-
60
-
61
-
62
-
63
-
64
-
65
-
66
-
67
-
68
-
69
-
70
-
71
-
72
-
73
-
74
-
75
-
76
-
77
-
78
-
79
-
80
-
81
-
82
-
83
-
84
-
85
-
86
-
87
-
88
-
89
-
90
-
91
-
92
-
93
-
94
-
95
-
96
-
97
-
98
-
99
-
100
-
101
-
102
-
103
-
104
-
105
-
106
-
107
-
108
-
109
-
110
-
111
-
112
-
113
-
114
-
115
-
116
-
117
-
118
-
119
-
120
-
121
-
122
-
123
-
124
-
125
-
126
-
127
-
128
-
129
-
130
-
131
-
132
-
133
-
134
-
135
-
136
-
137
-
138
-
139
-
140
-
141
-
142
-
143
-
144
-
145
-
146
-
147
-
148
-
149
-
150
-
151
-
152
-
153
-
154
-
155
-
156
-
157
-
158
-
159
-
160
-
161
-
162
-
163
-
164
-
165
-
166
-
167
-
168
-
169
-
170
-
171
-
172
-
173
-
174
-
175
-
176
-
177
-
178
-
179
-
180
-
181
-
182
-
183
-
184
-
185
-
186
-
187
-
188
-
189
-
190
-
191
-
192
-
193
-
194
-
195
-
196
-
197
-
198
-
199
-
200
-
201
-
202
-
203
-
204
-
205
-
206
-
207
-
208
-
209
-
210
-
211
-
212
-
213
-
214
-
215
-
216
-
217
-
218
-
219
-
220
-
221
-
222
-
223
-
224
-
225
-
226
-
227
-
228
-
229
-
230
-
231
-
232
-
233
-
234
-
235
-
236
-
237
-
238
-
239
-
240
-
241
-
242
-
243
-
244
-
245
-
246
-
247
-
248
-
249
-
250
-
251
-
252
 |
 |
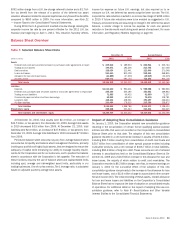
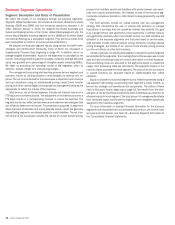
Business Segment Operations
Segment Description and Basis of Presentation
We report the results of our operations through six business segments:
Deposits, Global Card Services, Home Loans & Insurance, Global Commercial
Banking, GBAM and GWIM, with the remaining operations recorded in All
Other. Effective January 1, 2010, we realigned the Global Corporate and
Investment Banking portion of the former Global Banking segmentwiththe
former Global Markets business segment to form GBAM and to reflect Global
Commercial Banking as a standalone segment. Prior period amounts have
been reclassified to conform to current period presentation.
We prepare and evaluate segment results using certain non-GAAP meth-
odologies and performance measures, many of which are discussed in
Supplemental Financial Data beginning on page 40. In addition, return on
average tangible shareholders’ equity for the segments is calculated as net
income, excluding goodwill impairment charges, divided by average allocated
equity less goodwill and a percentage of intangible assets (excluding MSRs).
We begin by evaluating the operating results of the segments which by
definition exclude merger and restructuring charges.
The management accounting and reporting process derives segment and
business results by utilizing allocation methodologies for revenue and ex-
pense. The net income derived for the businesses is dependent upon revenue
and cost allocations using an activity-based costing model, funds transfer
pricing, and other methodologies and assumptions management believes are
appropriate to reflect the results of the business.
Total revenue, net of interest expense, includes net interest income on a
FTE basis and noninterest income. The adjustment of net interest income to a
FTE basis results in a corresponding increase in income tax expense. The
segment results also reflect certain revenue and expense methodologies that
are utilized to determine net income. For presentation purposes, in segments
where the total of liabilities and equity exceeds assets, which are generally
deposit-taking segments, we allocate assets to match liabilities. The net inter-
est income of the businesses includes the results of a funds transfer pricing
process that matches assets and liabilities with similar interest rate sensi-
tivity and maturity characteristics. Net interest income of the business seg-
ments also includes an allocation of net interest income generated by our ALM
activities.
Our ALM activities include an overall interest rate risk management
strategy that incorporates the use of interest rate contracts to manage
fluctuations in earnings that are caused by interest rate volatility. Our goal
is to manage interest rate sensitivity so that movements in interest rates do
not significantly adversely affect net interest income. Our ALM activities are
allocated to the business segments and fluctuate based on performance.
ALM activities include external product pricing decisions including deposit
pricing strategies, the effects of our internal funds transfer pricing process
and the net effects of other ALM activities.
Certain expenses not directly attributable to a specific business segment
are allocated to the segments. The most significant of these expenses include
data and item processing costs and certain centralized or shared functions.
Data processing costs are allocated to the segments based on equipment
usage. Item processing costs are allocated to the segments based on the
volume of items processed for each segment. The costs of certain centralized
or shared functions are allocated based on methodologies that reflect
utilization.
Equity is allocated to business segments and related businesses using a
risk-adjusted methodology incorporating each segment’s credit, market, in-
terest rate, strategic and operational risk components. The nature of these
risks is discussed further beginning on page 63. We benefit from the diver-
sification of risk across these components which is reflected as a reduction to
allocated equity for each segment. The total amount of average equity reflects
both risk-based capital and the portion of goodwill and intangibles specifically
assigned to the business segments.
For more information on selected financial information for the business
segments and reconciliations to consolidated total revenue, net income (loss)
and year-end total assets, see Note 26 – Business Segment Information to
the Consolidated Financial Statements.
42 Bank of America 2010