Bank of America 2010 Annual Report Download - page 131
Download and view the complete annual report
Please find page 131 of the 2010 Bank of America annual report below. You can navigate through the pages in the report by either clicking on the pages listed below, or by using the keyword search tool below to find specific information within the annual report.-
 1
1 -
2
-
3
-
4
-
5
-
6
-
7
-
8
-
9
-
10
-
11
-
12
-
13
-
14
-
15
-
16
-
17
-
18
-
19
-
20
-
21
-
22
-
23
-
24
-
25
-
26
-
27
-
28
-
29
-
30
-
31
-
32
-
33
-
34
-
35
-
36
-
37
-
38
-
39
-
40
-
41
-
42
-
43
-
44
-
45
-
46
-
47
-
48
-
49
-
50
-
51
-
52
-
53
-
54
-
55
-
56
-
57
-
58
-
59
-
60
-
61
-
62
-
63
-
64
-
65
-
66
-
67
-
68
-
69
-
70
-
71
-
72
-
73
-
74
-
75
-
76
-
77
-
78
-
79
-
80
-
81
-
82
-
83
-
84
-
85
-
86
-
87
-
88
-
89
-
90
-
91
-
92
-
93
-
94
-
95
-
96
-
97
-
98
-
99
-
100
-
101
-
102
-
103
-
104
-
105
-
106
-
107
-
108
-
109
-
110
-
111
-
112
-
113
-
114
-
115
-
116
-
117
-
118
-
119
-
120
-
 121
121 -
 122
122 -
 123
123 -
 124
124 -
 125
125 -
 126
126 -
 127
127 -
 128
128 -
 129
129 -
 130
130 -
 131
131 -
 132
132 -
 133
133 -
 134
134 -
 135
135 -
 136
136 -
 137
137 -
 138
138 -
 139
139 -
 140
140 -
 141
141 -
142
-
143
-
144
-
145
-
146
-
147
-
148
-
149
-
150
-
151
-
152
-
153
-
154
-
155
-
156
-
157
-
158
-
159
-
160
-
161
-
162
-
163
-
164
-
165
-
166
-
167
-
168
-
169
-
170
-
171
-
172
-
173
-
174
-
175
-
176
-
177
-
178
-
179
-
180
-
181
-
182
-
183
-
184
-
185
-
186
-
187
-
188
-
189
-
190
-
191
-
192
-
193
-
194
-
195
-
196
-
197
-
198
-
199
-
200
-
201
-
202
-
203
-
204
-
205
-
206
-
207
-
208
-
209
-
210
-
211
-
212
-
213
-
214
-
215
-
216
-
217
-
218
-
219
-
220
-
221
-
222
-
223
-
224
-
225
-
226
-
227
-
228
-
229
-
230
-
231
-
232
-
233
-
234
-
235
-
236
-
237
-
238
-
239
-
240
-
241
-
242
-
243
-
244
-
245
-
246
-
247
-
248
-
249
-
250
-
251
-
252
 |
 |

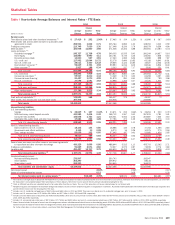
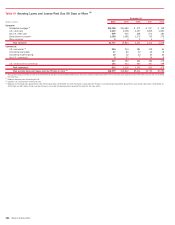
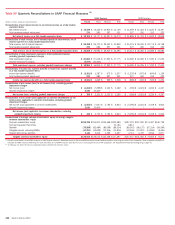
Table XII Selected Quarterly Financial Data
(Dollars in millions, except per share information)
Fourth
Third Second First Fourth Third Second First
2010 Quarters 2009 Quarters
Income statement
Net interest income
$12,439
$ 12,435 $ 12,900 $ 13,749 $ 11,559 $ 11,423 $ 11,630 $ 12,497
Noninterest income
9,959
14,265 16,253 18,220 13,517 14,612 21,144 23,261
Total revenue, net of interest expense
22,398
26,700 29,153 31,969 25,076 26,035 32,774 35,758
Provision for credit losses
5,129
5,396 8,105 9,805 10,110 11,705 13,375 13,380
Goodwill impairment
2,000
10,400 – – ––––
Merger and restructuring charges
370
421 508 521 533 594 829 765
All other noninterest expense
(1)
18,494
16,395 16,745 17,254 15,852 15,712 16,191 16,237
Income (loss) before income taxes
(3,595)
(5,912) 3,795 4,389 (1,419) (1,976) 2,379 5,376
Income tax expense (benefit)
(2,351)
1,387 672 1,207 (1,225) (975) (845) 1,129
Net income (loss)
(1,244)
(7,299) 3,123 3,182 (194) (1,001) 3,224 4,247
Net income (loss) applicable to common shareholders
(1,565)
(7,647) 2,783 2,834 (5,196) (2,241) 2,419 2,814
Average common shares issued and outstanding (in thousands)
10,036,575
9,976,351 9,956,773 9,177,468 8,634,565 8,633,834 7,241,515 6,370,815
Average diluted common shares issued and outstanding (in
thousands)
10,036,575
9,976,351 10,029,776 10,005,254 8,634,565 8,633,834 7,269,518 6,431,027
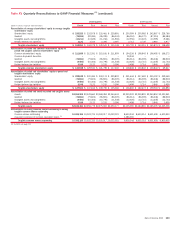
Performance ratios
Return on average assets
n/m
n/m 0.50% 0.51% n/m n/m 0.53% 0.68%
Four quarter trailing return on average assets
(2)
n/m
n/m 0.20 0.21 0.26% 0.20% 0.28 0.28
Return on average common shareholders’ equity
n/m
n/m 5.18 5.73 n/m n/m 5.59 7.10
Return on average tangible common shareholders’ equity
(3)
n/m
n/m 9.19 9.79 n/m n/m 12.68 16.15
Return on average tangible shareholders’ equity
(3)
n/m
n/m 8.98 9.55 n/m n/m 8.86 12.42
Total ending equity to total ending assets
10.08%
9.85% 9.85 9.80 10.38 11.40 11.29 10.32
Total average equity to total average assets
9.94
9.83 9.36 9.14 10.31 10.67 10.01 9.08
Dividend payout
n/m
n/m 3.63 3.57 n/m n/m 3.56 2.28
Per common share data
Earnings (loss)
$ (0.16)
$ (0.77) $ 0.28 $ 0.28 $ (0.60) $ (0.26) $ 0.33 $ 0.44
Diluted earnings (loss)
(0.16)
(0.77) 0.27 0.28 (0.60) (0.26) 0.33 0.44
Dividends paid
0.01
0.01 0.01 0.01 0.01 0.01 0.01 0.01
Book value
20.99
21.17 21.45 21.12 21.48 22.99 22.71 25.98
Tangible book value
(3)
12.98
12.91 12.14 11.70 11.94 12.00 11.66 10.88
Market price per share of common stock
Closing
$13.34
$ 13.10 $ 14.37 $ 17.85 $ 15.06 $ 16.92 $ 13.20 $ 6.82
High closing
13.56
15.67 19.48 18.04 18.59 17.98 14.17 14.33
Low closing
10.95
12.32 14.37 14.45 14.58 11.84 7.05 3.14
Market capitalization
$ 134,536
$ 131,442 $ 144,174 $ 179,071 $ 130,273 $ 146,363 $ 114,199 $ 43,654
Average balance sheet
Total loans and leases
$ 940,614
$ 934,860 $ 967,054 $ 991,615 $ 905,913 $ 930,255 $ 966,105 $ 994,121
Total assets
2,370,258
2,379,397 2,494,432 2,516,590 2,431,024 2,398,201 2,425,377 2,519,134
Total deposits
1,007,738
973,846 991,615 981,015 995,160 989,295 974,892 964,081
Long-term debt
465,875
485,588 497,469 513,634 445,440 449,974 444,131 446,975
Common shareholders’ equity
218,728
215,911 215,468 200,380 197,123 197,230 173,497 160,739
Total shareholders’ equity
235,525
233,978 233,461 229,891 250,599 255,983 242,867 228,766
Asset quality
(4)
Allowance for credit losses
(5)
$43,073
$ 44,875 $ 46,668 $ 48,356 $ 38,687 $ 37,399 $ 35,777 $ 31,150
Nonperforming loans, leases and foreclosed properties
(6)
32,664
34,556 35,598 35,925 35,747 33,825 30,982 25,632
Allowance for loan and lease losses as a percentage of total loans
and leases outstanding
(6)
4.47%
4.69% 4.75% 4.82% 4.16% 3.95% 3.61% 3.00%
Allowance for loan and lease losses as a percentage of total
nonperforming loans and leases
(6, 7)
136
135 137 139 111 112 116 122
Allowance for loan and lease losses as a percentage of total
nonperforming loans and leases excluding the purchased credit-
impaired loan portfolio
(6, 7)
116
118 121 124 99 101 108 115
Net charge-offs
$6,783
$ 7,197 $ 9,557 $ 10,797 $ 8,421 $ 9,624 $ 8,701 $ 6,942
Annualized net charge-offs as a percentage of average loans and
leases outstanding
(6)
2.87%
3.07% 3.98% 4.44% 3.71% 4.13% 3.64% 2.85%
Nonperforming loans and leases as a percentage of total loans and
leases outstanding
(6)
3.27
3.47 3.48 3.46 3.75 3.51 3.12 2.47
Nonperforming loans, leases and foreclosed properties as a
percentage of total loans, leases and foreclosed properties
(6)
3.48
3.71 3.73 3.69 3.98 3.72 3.31 2.64
Ratio of the allowance for loan and lease losses at period end to
annualized net charge-offs
1.56
1.53 1.18 1.07 1.11 0.94 0.97 1.03
Capital ratios (period end)
Risk-based capital:
Tier 1 common
8.60%
8.45% 8.01% 7.60% 7.81% 7.25% 6.90% 4.49%
Tier 1
11.24
11.16 10.67 10.23 10.40 12.46 11.93 10.09
Total
15.77
15.65 14.77 14.47 14.66 16.69 15.99 14.03
Tier 1 leverage
7.21
7.21 6.68 6.44 6.88 8.36 8.17 7.07
Tangible equity
(3)
6.75
6.54 6.14 6.02 6.40 7.51 7.37 6.42
Tangible common equity
(3)
5.99
5.74 5.35 5.22 5.56 4.80 4.66 3.13
(1)
Excludes merger and restructuring charges and goodwill impairment charges.
(2)
Calculated as total net income for four consecutive quarters divided by average assets for the period.
(3)
Tangible equity ratios and tangible book value per share of common stock are non-GAAP measures. Other companies may define or calculate these measures differently. For additional information on these ratios, see Supplemental
Financial Data beginning on page 40 and for corresponding reconciliations to GAAP financial measures, see Table XV.
(4)
For more information on the impact of the PCI loan portfolio on asset quality, see Consumer Portfolio Credit Risk Management beginning on page 76 and Commercial Portfolio Credit Risk Management beginning on page 87.
(5)
Includes the allowance for loan and lease losses and the reserve for unfunded lending commitments.
(6)
Balances and ratios do not include loans accounted for under the fair value option. For additional exclusions on nonperforming loans, leases and foreclosed properties, see Nonperforming Consumer Loans and Foreclosed Properties
Activity beginning on page 85 and corresponding Table 33 and Nonperforming Commercial Loans, Leases and Foreclosed Properties Activity and corresponding Table 41 on page 93.
(7)
Allowance for loan and lease losses includes $22.9 billion, $23.7 billion, $24.3 billion, $26.2 billion, $17.7 billion, $17.2 billion, $16.5 billion and $14.9 billion allocated to products that are excluded from nonperforming loans,
leases and foreclosed properties at December 31, 2010, September 30, 2010, June 30, 2010, March 31, 2010, December 31, 2009, September 30, 2009, June 30, 2009, and March 31, 2009, respectively.
n/m = not meaningful
Bank of America 2010 129