Bank of America 2010 Annual Report Download - page 34
Download and view the complete annual report
Please find page 34 of the 2010 Bank of America annual report below. You can navigate through the pages in the report by either clicking on the pages listed below, or by using the keyword search tool below to find specific information within the annual report.-
 1
1 -
2
-
3
-
4
-
5
-
6
-
7
-
8
-
9
-
10
-
11
-
12
-
13
-
14
-
15
-
16
-
17
-
18
-
19
-
20
-
21
-
22
-
23
-
 24
24 -
 25
25 -
 26
26 -
 27
27 -
 28
28 -
 29
29 -
 30
30 -
 31
31 -
 32
32 -
 33
33 -
 34
34 -
 35
35 -
 36
36 -
 37
37 -
 38
38 -
 39
39 -
 40
40 -
 41
41 -
 42
42 -
 43
43 -
 44
44 -
45
-
46
-
47
-
48
-
49
-
50
-
51
-
52
-
53
-
54
-
55
-
56
-
57
-
58
-
59
-
60
-
61
-
62
-
63
-
64
-
65
-
66
-
67
-
68
-
69
-
70
-
71
-
72
-
73
-
74
-
75
-
76
-
77
-
78
-
79
-
80
-
81
-
82
-
83
-
84
-
85
-
86
-
87
-
88
-
89
-
90
-
91
-
92
-
93
-
94
-
95
-
96
-
97
-
98
-
99
-
100
-
101
-
102
-
103
-
104
-
105
-
106
-
107
-
108
-
109
-
110
-
111
-
112
-
113
-
114
-
115
-
116
-
117
-
118
-
119
-
120
-
121
-
122
-
123
-
124
-
125
-
126
-
127
-
128
-
129
-
130
-
131
-
132
-
133
-
134
-
135
-
136
-
137
-
138
-
139
-
140
-
141
-
142
-
143
-
144
-
145
-
146
-
147
-
148
-
149
-
150
-
151
-
152
-
153
-
154
-
155
-
156
-
157
-
158
-
159
-
160
-
161
-
162
-
163
-
164
-
165
-
166
-
167
-
168
-
169
-
170
-
171
-
172
-
173
-
174
-
175
-
176
-
177
-
178
-
179
-
180
-
181
-
182
-
183
-
184
-
185
-
186
-
187
-
188
-
189
-
190
-
191
-
192
-
193
-
194
-
195
-
196
-
197
-
198
-
199
-
200
-
201
-
202
-
203
-
204
-
205
-
206
-
207
-
208
-
209
-
210
-
211
-
212
-
213
-
214
-
215
-
216
-
217
-
218
-
219
-
220
-
221
-
222
-
223
-
224
-
225
-
226
-
227
-
228
-
229
-
230
-
231
-
232
-
233
-
234
-
235
-
236
-
237
-
238
-
239
-
240
-
241
-
242
-
243
-
244
-
245
-
246
-
247
-
248
-
249
-
250
-
251
-
252
 |
 |

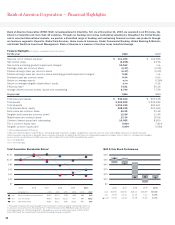
Financial Highlights
Net Interest Income
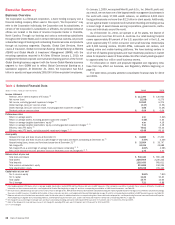
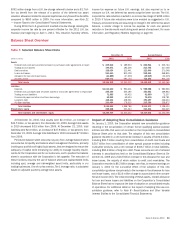
Net interest income on a FTE basis increased $4.3 billion to $52.7 billion for
2010 compared to 2009. The increase was due to the impact of deposit
pricing and the adoption of new consolidation guidance which contributed
$10.5 billion to net interest income in 2010. The increase was partially offset
by lower commercial and consumer loan levels, the sale of First Republic in
2010 and lower rates on the core assets and trading assets and liabilities,
including derivatives exposure. The net interest yield on a FTE basis increased
13 basis points (bps) to 2.78 percent for 2010 compared to 2009 due to
these same factors.
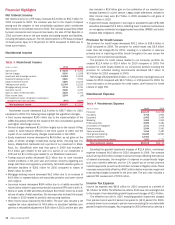
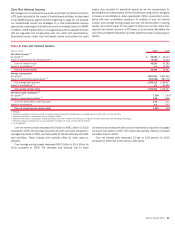
Noninterest Income
Table 3 Noninterest Income
(Dollars in millions)
2010 2009
Card income
$8,108
$8,353
Service charges
9,390
11,038
Investment and brokerage services
11,622
11,919
Investment banking income
5,520
5,551
Equity investment income
5,260
10,014
Trading account profits
10,054
12,235
Mortgage banking income
2,734
8,791
Insurance income
2,066
2,760
Gains on sales of debt securities
2,526
4,723
Other income (loss)
2,384
(14)
Net impairment losses recognized in earnings on
available-for-sale debt securities
(967)
(2,836)
Total noninterest income
$58,697
$72,534
Noninterest income decreased $13.8 billion to $58.7 billion for 2010
compared to 2009. The following items highlight the significant changes.
• Card income decreased $245 million due to the implementation of the
CARD Act partially offset by the impact of the new consolidation guidance
and higher interchange income.
• Service charges decreased $1.6 billion largely due to the impact of Reg-
ulation E, which became effective in the third quarter of 2010 and the
impact of our overdraft policy changes implemented in late 2009.
• Equity investment income decreased by $4.8 billion, as net gains on the
sales of certain strategic investments during 2010, including Itaú Uni-
banco, MasterCard, Santander and a portion of our investment in Black-
Rock, Inc. (BlackRock) were less than gains in 2009 that included a
$7.3 billion gain related to the sale of a portion of our investment in
CCB and the $1.1 billion gain related to our BlackRock investment.
• Trading account profits decreased $2.2 billion due to more favorable
market conditions in the prior year and investor concerns regarding sov-
ereign debt fears and regulatory uncertainty. Net credit valuation gains on
derivative liabilities of $262 million for 2010 compared to losses of
$662 million for 2009.
• Mortgage banking income decreased $6.1 billion due to an increase of
$4.9 billion in representations and warranties provision and lower volume
and margins.
• Insurance income decreased $694 million due to a liability recorded for
future claims related to payment protection insurance (PPI) sold in the U.K.
• Gains on sales of debt securities decreased $2.2 billion driven by a lower
volume of sales of debt securities. The decrease also included the impact
of losses in 2010 related to portfolio restructuring activities.
• Other income (loss) improved by $2.4 billion. The prior year included a net
negative fair value adjustment of $4.9 billion on structured liabilities com-
pared to a net positive adjustment of $18 million in 2010, and the prior year
also included a $3.8 billion gain on the contribution of our merchant pro-
cessing business to a joint venture. Legacy asset write-downs included in
other income (loss) were $1.7 billion in 2009 compared to net gains of
$256 million in 2010.
• Impairment losses recognized in earnings on available-for-sale (AFS) debt
securities decreased $1.9 billion reflecting lower impairment write-downs
on non-agency residential mortgage-backed securities (RMBS) and collat-
eralized debt obligations (CDOs).
Provision for Credit Losses
The provision for credit losses decreased $20.1 billion to $28.4 billion in
2010 compared to 2009. The provision for credit losses was $5.9 billion
lower than net charge-offs for 2010, resulting in a reduction in reserves
primarily due to improving portfolio trends throughout the year across the
consumer and commercial businesses.
The provision for credit losses related to our consumer portfolio de-
creased $11.4 billion to $25.4 billion for 2010 compared to 2009. The
provision for credit losses related to our commercial portfolio including the
provision for unfunded lending commitments decreased $8.7 billion to
$3.0 billion for 2010 compared to 2009.
Net charge-offs totaled $34.3 billion, or 3.60 percent of average loans and
leases for 2010 compared with $33.7 billion, or 3.58 percent for 2009. For
more information on the provision for credit losses, see Provision for Credit
Losses on page 100.
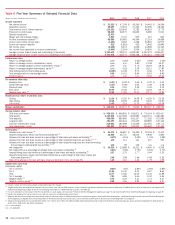
Noninterest Expense
Table 4 Noninterest Expense
(Dollars in millions)
2010 2009
Personnel
$35,149
$31,528
Occupancy
4,716
4,906
Equipment
2,452
2,455
Marketing
1,963
1,933
Professional fees
2,695
2,281
Amortization of intangibles
1,731
1,978
Data processing
2,544
2,500
Telecommunications
1,416
1,420
Other general operating
16,222
14,991
Goodwill impairment
12,400
–
Merger and restructuring charges
1,820
2,721
Total noninterest expense
$83,108
$66,713
Excluding the goodwill impairment charges of $12.4 billion, noninterest
expense increased $4.0 billion for 2010 compared to 2009. The increase
was driven by a $3.6 billion increase in personnel costs reflecting the build out
of several businesses, the recognition of expense on proportionally larger
prior year incentive deferrals and the U.K. payroll tax on certain year-end
incentive payments, as well as a $1.6 billion increase in litigation costs. These
increases were partially offset by a $901 million decline in pre-tax merger and
restructuring charges compared to the prior year. The prior year included a
special FDIC assessment of $724 million.
Income Tax Expense
Income tax expense was $915 million for 2010 compared to a benefit of
$1.9 billion for 2009. The effective tax rate for 2010 was not meaningful due
to the impact of non-deductible goodwill impairment charges of $12.4 billion.
The effective tax rate for 2010 excluding goodwill impairment charges
from pre-tax income was 8.3 percent compared to (44.0) percent for 2009,
primarily driven by an increase in pre-tax income excluding the non-deductible
goodwill impairment charges. Also impacting the 2010 effective tax rate was a
32 Bank of America 2010