Bank of America 2010 Annual Report Download - page 170
Download and view the complete annual report
Please find page 170 of the 2010 Bank of America annual report below. You can navigate through the pages in the report by either clicking on the pages listed below, or by using the keyword search tool below to find specific information within the annual report.-
 1
1 -
2
-
3
-
4
-
5
-
6
-
7
-
8
-
9
-
10
-
11
-
12
-
13
-
14
-
15
-
16
-
17
-
18
-
19
-
20
-
21
-
22
-
23
-
24
-
25
-
26
-
27
-
28
-
29
-
30
-
31
-
32
-
33
-
34
-
35
-
36
-
37
-
38
-
39
-
40
-
41
-
42
-
43
-
44
-
45
-
46
-
47
-
48
-
49
-
50
-
51
-
52
-
53
-
54
-
55
-
56
-
57
-
58
-
59
-
60
-
61
-
62
-
63
-
64
-
65
-
66
-
67
-
68
-
69
-
70
-
71
-
72
-
73
-
74
-
75
-
76
-
77
-
78
-
79
-
80
-
81
-
82
-
83
-
84
-
85
-
86
-
87
-
88
-
89
-
90
-
91
-
92
-
93
-
94
-
95
-
96
-
97
-
98
-
99
-
100
-
101
-
102
-
103
-
104
-
105
-
106
-
107
-
108
-
109
-
110
-
111
-
112
-
113
-
114
-
115
-
116
-
117
-
118
-
119
-
120
-
121
-
122
-
123
-
124
-
125
-
126
-
127
-
128
-
129
-
130
-
131
-
132
-
133
-
134
-
135
-
136
-
137
-
138
-
139
-
140
-
141
-
142
-
143
-
144
-
145
-
146
-
147
-
148
-
149
-
150
-
151
-
152
-
153
-
154
-
155
-
156
-
157
-
158
-
159
-
 160
160 -
 161
161 -
 162
162 -
 163
163 -
 164
164 -
 165
165 -
 166
166 -
 167
167 -
 168
168 -
 169
169 -
 170
170 -
 171
171 -
 172
172 -
 173
173 -
 174
174 -
 175
175 -
 176
176 -
 177
177 -
 178
178 -
 179
179 -
 180
180 -
181
-
182
-
183
-
184
-
185
-
186
-
187
-
188
-
189
-
190
-
191
-
192
-
193
-
194
-
195
-
196
-
197
-
198
-
199
-
200
-
201
-
202
-
203
-
204
-
205
-
206
-
207
-
208
-
209
-
210
-
211
-
212
-
213
-
214
-
215
-
216
-
217
-
218
-
219
-
220
-
221
-
222
-
223
-
224
-
225
-
226
-
227
-
228
-
229
-
230
-
231
-
232
-
233
-
234
-
235
-
236
-
237
-
238
-
239
-
240
-
241
-
242
-
243
-
244
-
245
-
246
-
247
-
248
-
249
-
250
-
251
-
252
 |
 |

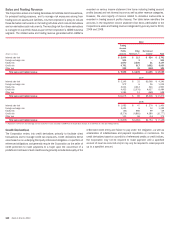
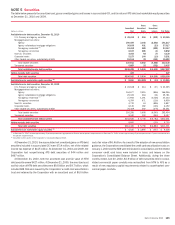
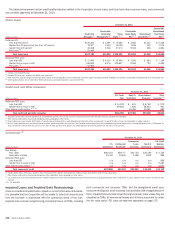
The amortized cost and fair value of the Corporation’s investment in AFS debt securities from Fannie Mae (FNMA), the Government National Mortgage
Association (GNMA), Freddie Mac (FHLMC) and U.S. Treasury securities where the investment exceeded 10 percent of consolidated shareholders’ equityat
December 31, 2010 and 2009 are presented in the table below.
(Dollars in millions)
Amortized
Cost Fair Value
Amortized
Cost Fair Value
2010 2009
December 31
Fannie Mae
$123,662 $123,107
$100,321 $101,096
Government National Mortgage Association
72,863 74,305
60,610 61,121
Freddie Mac
30,523 30,822
29,076 29,810
U.S. Treasury securities
(1)
46,576 46,081
19,315 19,516
(1)
Investments in U.S. Treasury securities did not exceed 10 percent of consolidated shareholders’ equity at December 31, 2009.
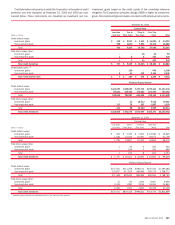
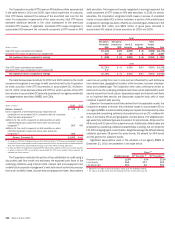
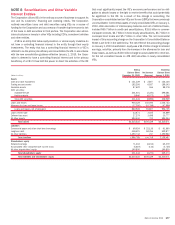
The expected maturity distribution of the Corporation’s MBS and the
contractual maturity distribution of the Corporation’s other AFS debt securi-
ties, and the yields on the Corporation’s AFS debt securities portfolio at
December 31, 2010 are summarized in the table below. Actual maturities may
differ from the contractual or expected maturities since borrowers may have
the right to prepay obligations with or without prepayment penalties.
(Dollars in millions)
Amount Yield
(1)
Amount Yield
(1)
Amount Yield
(1)
Amount Yield
(1)
Amount Yield
(1)
Due in One
Year or Less
Due after One Year
through Five Years
Due after Five Years
through Ten Years Due after Ten Years Total
December 31, 2010
Amortized cost of AFS debt securities
U.S. Treasury and agency securities $ 643 5.00% $ 1,731 2.30% $ 12,318 3.50% $ 34,721 4.20%
$ 49,413 4.00%
Mortgage-backed securities:
Agency 34 4.80 88,913 4.30 70,789 3.80 30,673 3.90
190,409 4.10
Agency-collateralized mortgage obligations 29 0.80 13,279 2.80 13,738 0.20 9,593 2.30
36,639 3.20
Non-agency residential 178 12.50 4,241 7.40 1,746 5.60 17,293 4.20
23,458 4.90
Non-agency commercial 439 5.20 4,960 6.30 441 9.80 327 6.70
6,167 6.50
Non-U.S. securities 1,852 0.80 2,076 5.40 126 3.50 –
4,054 5.30
Corporate bonds 133 1.20 3,847 2.30 1,114 3.70 63 2.20
5,157 2.60
Other taxable securities 6,129 0.90 3,875 1.20 118 11.20 5,392 3.80
15,514 2.09
Total taxable securities 9,437 1.62 122,922 4.16 100,390 3.35 98,062 3.91
330,811 3.98
Tax-exempt securities 193 4.10 912 4.30 1,408 3.80 3,174 4.60
5,687 4.35
Total amortized cost of AFS debt securities $9,630 1.72 $123,834 4.16 $101,798 3.36 $101,236 3.93 $336,498 3.99
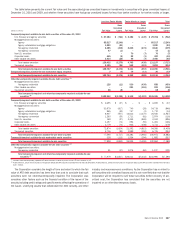
Fair value of AFS debt securities
U.S. Treasury and agency securities $ 646 $ 1,769 $ 12,605 $ 34,085
$49,105
Mortgage-backed securities:
Agency 36 90,967 70,031 30,183
191,217
Agency-collateralized mortgage obligations 22 13,402 13,920 9,673
37,017
Non-agency residential 158 4,149 1,739 17,071
23,117
Non-agency commercial 448 5,498 543 363
6,852
Non-U.S. securities 1,868 2,140 131 –
4,139
Corporate bonds 136 3,929 1,162 64
5,291
Other taxable securities 6,132 3,863 118 5,279
15,392
Total taxable securities 9,446 125,717 100,249 96,718
332,130
Tax-exempt securities 193 923 1,408 2,973
5,497
Total fair value of AFS debt securities $9,639 $126,640 $101,657 $ 99,691 $337,627
(1)
Yields are calculated based on the amortized cost of the securities.
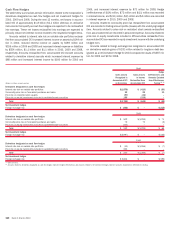
The components of realized gains and losses on sales of debt securities
for 2010, 2009 and 2008 are presented in the table below.
(Dollars in millions)
2010 2009 2008
Gross gains
$3,995
$5,047 $1,367
Gross losses
(1,469)
(324) (243)
Net gains on sales of debt securities
$2,526
$4,723 $1,124
Income tax expense attributable to realized net gains
on sales of debt securities
$935
$1,748 $ 416
During 2010, the Corporation entered into a series of transactions in its
AFS debt securities portfolio that involved securitizations as well as sales of
non-agency RMBS. These transactions were initiated following a review of
corporate risk objectives in light of proposed Basel regulatory capital changes
and liquidity targets. During 2010, the carrying value of the non-agency RMBS
portfolio was reduced $14.5 billion primarily as a result of the aforementioned
sales and securitizations as well as paydowns. The Corporation recognized
net losses of $922 million on the series of transactions in the AFS debt
securities portfolio, and improved the overall credit quality of the remaining
portfolio such that the percentage of the non-agency RMBS portfolio that is
below investment-grade was reduced significantly.
168 Bank of America 2010