Bank of America 2010 Annual Report Download - page 24
Download and view the complete annual report
Please find page 24 of the 2010 Bank of America annual report below. You can navigate through the pages in the report by either clicking on the pages listed below, or by using the keyword search tool below to find specific information within the annual report.-
 1
1 -
2
-
3
-
4
-
5
-
6
-
7
-
8
-
9
-
10
-
11
-
12
-
13
-
 14
14 -
 15
15 -
 16
16 -
 17
17 -
 18
18 -
 19
19 -
 20
20 -
 21
21 -
 22
22 -
 23
23 -
 24
24 -
 25
25 -
 26
26 -
 27
27 -
 28
28 -
 29
29 -
 30
30 -
 31
31 -
 32
32 -
 33
33 -
 34
34 -
35
-
36
-
37
-
38
-
39
-
40
-
41
-
42
-
43
-
44
-
45
-
46
-
47
-
48
-
49
-
50
-
51
-
52
-
53
-
54
-
55
-
56
-
57
-
58
-
59
-
60
-
61
-
62
-
63
-
64
-
65
-
66
-
67
-
68
-
69
-
70
-
71
-
72
-
73
-
74
-
75
-
76
-
77
-
78
-
79
-
80
-
81
-
82
-
83
-
84
-
85
-
86
-
87
-
88
-
89
-
90
-
91
-
92
-
93
-
94
-
95
-
96
-
97
-
98
-
99
-
100
-
101
-
102
-
103
-
104
-
105
-
106
-
107
-
108
-
109
-
110
-
111
-
112
-
113
-
114
-
115
-
116
-
117
-
118
-
119
-
120
-
121
-
122
-
123
-
124
-
125
-
126
-
127
-
128
-
129
-
130
-
131
-
132
-
133
-
134
-
135
-
136
-
137
-
138
-
139
-
140
-
141
-
142
-
143
-
144
-
145
-
146
-
147
-
148
-
149
-
150
-
151
-
152
-
153
-
154
-
155
-
156
-
157
-
158
-
159
-
160
-
161
-
162
-
163
-
164
-
165
-
166
-
167
-
168
-
169
-
170
-
171
-
172
-
173
-
174
-
175
-
176
-
177
-
178
-
179
-
180
-
181
-
182
-
183
-
184
-
185
-
186
-
187
-
188
-
189
-
190
-
191
-
192
-
193
-
194
-
195
-
196
-
197
-
198
-
199
-
200
-
201
-
202
-
203
-
204
-
205
-
206
-
207
-
208
-
209
-
210
-
211
-
212
-
213
-
214
-
215
-
216
-
217
-
218
-
219
-
220
-
221
-
222
-
223
-
224
-
225
-
226
-
227
-
228
-
229
-
230
-
231
-
232
-
233
-
234
-
235
-
236
-
237
-
238
-
239
-
240
-
241
-
242
-
243
-
244
-
245
-
246
-
247
-
248
-
249
-
250
-
251
-
252
 |
 |
22
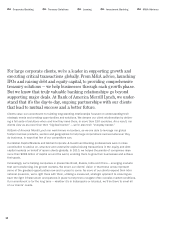
Bank of America Corporation (NYSE: BAC) is headquartered in Charlotte, N.C. As of December 31, 2010, we operated in all 50 states, the
District of Columbia and more than 40 countries. Through our banking and various nonbanking subsidiaries throughout the United States
and in selected international markets, we provide a diversified range of banking and nonbanking financial services and products through
six business segments: Deposits, Global Card Services, Home Loans & Insurance, Global Commercial Banking, Global Banking & Markets
and Global Wealth & Investment Management. Bank of America is a member of the Dow Jones Industrial Average.
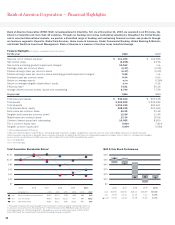
Financial Highlights (in millions, except per share information)
For the year 2010 2009
Revenue net of interest expense1 $ 111,390 $ 120,944
Net income (loss) (2,238) 6,276
Net income excluding goodwill impairment charges2 10,162 n/a
Earnings (loss) per common share (0.37) (0.29)
Diluted earnings (loss) per common share (0.37) (0.29)
Diluted earnings (loss) per common share excluding goodwill impairment charges2 0.86 n/a
Dividends paid per common share 0.04 0.04
Return on average assets n/m 0.26%
Return on average tangible shareholders’ equity n/m 4.18
Efficiency ratio1 74.61 55.16
Average diluted common shares issued and outstanding 9,790 7,729
At year end 2010 2009
Total loans and leases $ 940,440 $ 900,128
Total assets 2,264,909 2,230,232
Total deposits 1,010,430 991,611
Total shareholders’ equity 228,248 231,444
Book value per common share 20.99 21.48
Tangible book value per common share2 12.98 11.94
Market price per common share 13.34 15.06
Common shares issued and outstanding 10,085 8,650
Tier 1 common equity ratio 8.60% 7.81%
Tangible common equity ratio2 5.99% 5.56%
1 Fully taxable-equivalent (FTE) basis
2 Measures reported above using FTE basis, excluding goodwill impairment charges, tangible book value per common share and tangible equity are non-GAAP measures.
Other companies may define or calculate these measures differently. For additional information on the goodwill impairment charges, refer to Note 10
—
Goodwill and Intangible
Assets and for reconciliations to GAAP measures, refer to Table XIII in the 2010 Financial Review section.
n/a = not applicable
n/m = not meaningful
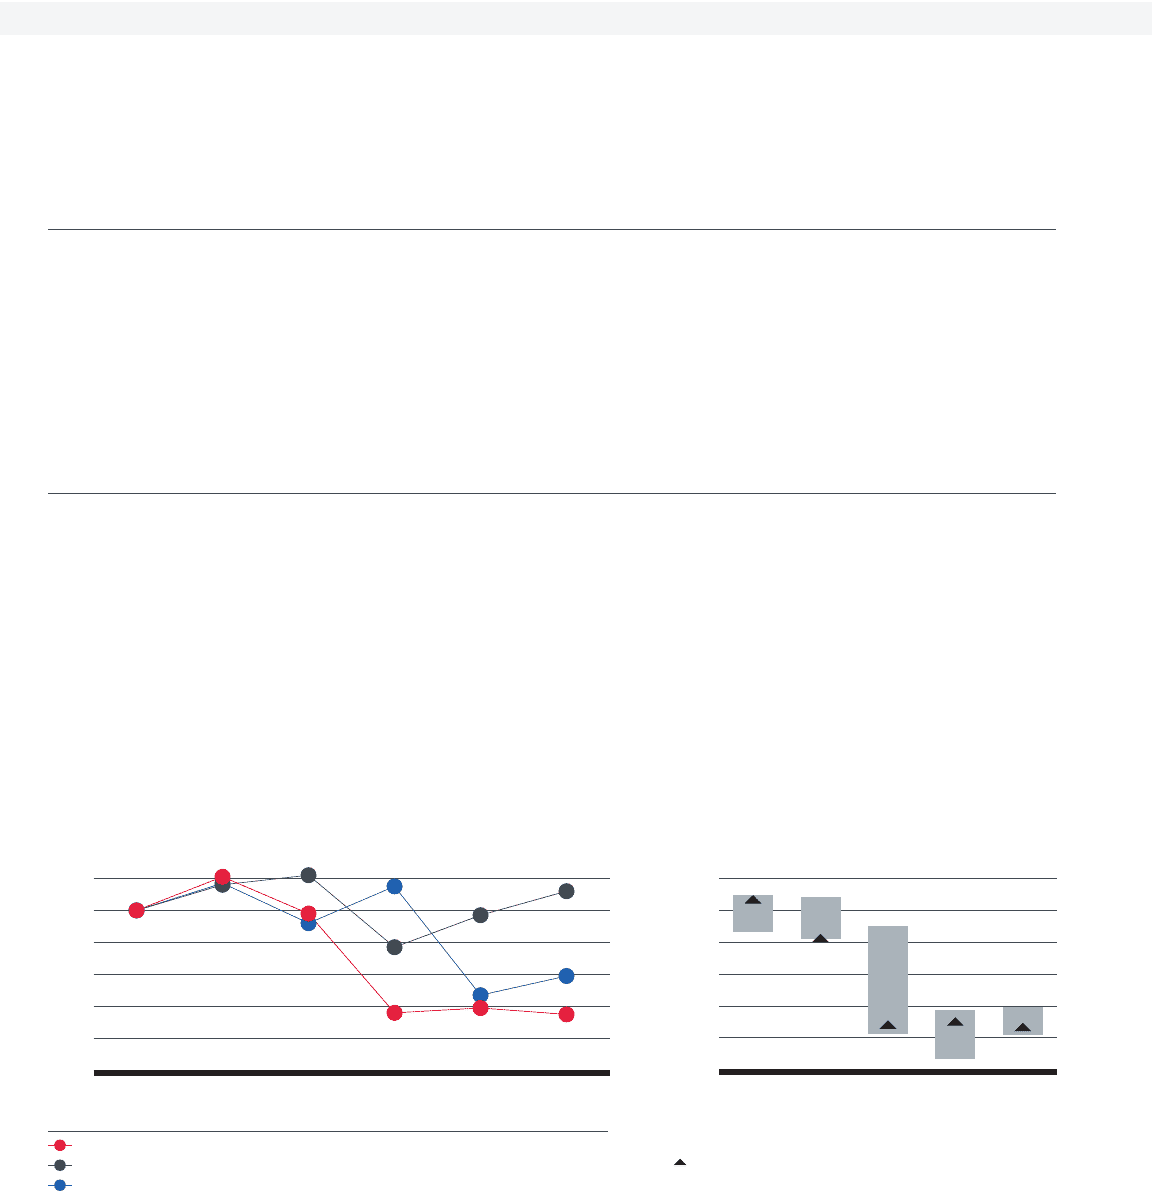
3 This graph compares the yearly change in the Corporation’s total cumulative shareholder return on
its common stock with (i) the Standard & Poor’s 500 Index and (ii) the KBW Bank Index for the years
ended December 31, 2006 through 2010. The graph assumes an initial investment of $100 at the
end of 2005 and the reinvestment of all dividends during the years indicated.
Total Cumulative Shareholder Return3
HIGH $54.90 $54.05 $45.03 $18.59 $19.48
LOW 43.09 41.10 11.25 3.14 10.95
CLOSE 53.39 41.26 14.08 15.06 13.34
December 31 2005 2006 2007 2008 2009 2010
BAC BANK OF AMERICA CORPORATION $100 $121 $98 $36 $39 $35
SPX S&P 500 INDEX $100 $116 $122 $77 $97 $112
BKX KBW BANK INDEX $100 $117 $92 $115 $47 $59
BAC 5-Year Stock Performance
Bank of America Corporation
—
Financial Highlights
$0
$20
$40
$60
$80
$100
$120
201020092008200720062005
$0
$10
$20
$30
$40
$50
$60
20102009200820072006