Bank of America 2010 Annual Report Download - page 70
Download and view the complete annual report
Please find page 70 of the 2010 Bank of America annual report below. You can navigate through the pages in the report by either clicking on the pages listed below, or by using the keyword search tool below to find specific information within the annual report.-
 1
1 -
2
-
3
-
4
-
5
-
6
-
7
-
8
-
9
-
10
-
11
-
12
-
13
-
14
-
15
-
16
-
17
-
18
-
19
-
20
-
21
-
22
-
23
-
24
-
25
-
26
-
27
-
28
-
29
-
30
-
31
-
32
-
33
-
34
-
35
-
36
-
37
-
38
-
39
-
40
-
41
-
42
-
43
-
44
-
45
-
46
-
47
-
48
-
49
-
50
-
51
-
52
-
53
-
54
-
55
-
56
-
57
-
58
-
59
-
 60
60 -
 61
61 -
 62
62 -
 63
63 -
 64
64 -
 65
65 -
 66
66 -
 67
67 -
 68
68 -
 69
69 -
 70
70 -
 71
71 -
 72
72 -
 73
73 -
 74
74 -
 75
75 -
 76
76 -
 77
77 -
 78
78 -
 79
79 -
 80
80 -
81
-
82
-
83
-
84
-
85
-
86
-
87
-
88
-
89
-
90
-
91
-
92
-
93
-
94
-
95
-
96
-
97
-
98
-
99
-
100
-
101
-
102
-
103
-
104
-
105
-
106
-
107
-
108
-
109
-
110
-
111
-
112
-
113
-
114
-
115
-
116
-
117
-
118
-
119
-
120
-
121
-
122
-
123
-
124
-
125
-
126
-
127
-
128
-
129
-
130
-
131
-
132
-
133
-
134
-
135
-
136
-
137
-
138
-
139
-
140
-
141
-
142
-
143
-
144
-
145
-
146
-
147
-
148
-
149
-
150
-
151
-
152
-
153
-
154
-
155
-
156
-
157
-
158
-
159
-
160
-
161
-
162
-
163
-
164
-
165
-
166
-
167
-
168
-
169
-
170
-
171
-
172
-
173
-
174
-
175
-
176
-
177
-
178
-
179
-
180
-
181
-
182
-
183
-
184
-
185
-
186
-
187
-
188
-
189
-
190
-
191
-
192
-
193
-
194
-
195
-
196
-
197
-
198
-
199
-
200
-
201
-
202
-
203
-
204
-
205
-
206
-
207
-
208
-
209
-
210
-
211
-
212
-
213
-
214
-
215
-
216
-
217
-
218
-
219
-
220
-
221
-
222
-
223
-
224
-
225
-
226
-
227
-
228
-
229
-
230
-
231
-
232
-
233
-
234
-
235
-
236
-
237
-
238
-
239
-
240
-
241
-
242
-
243
-
244
-
245
-
246
-
247
-
248
-
249
-
250
-
251
-
252
 |
 |

capital and Tier 1 capital of $9.7 billion. The overall effect of the new
consolidation guidance and the final rule was a decrease in Tier 1 capital
and Tier 1 common capital ratios of 76 bps and 73 bps on January 1, 2010.
We continued to strengthen capital in 2010 as evidenced by the $4.7 billion
growth in Tier 1 common capital or $14.4 billion before the impact of the new
consolidation guidance. The increase was driven by the $10.2 billion in earnings
generated in 2010, excluding the goodwill impairment charges of $12.4 billion.
Tier 1 capital and Total capital grew by $3.2 billion and $3.5 billion in 2010 or by
$13.0 billion and $12.9 billion when adjusted for the impact of the new
consolidation guidance.
Risk-weighted assets declined by $87 billion in 2010 including the impact
of the new consolidation guidance. The risk-weighted asset reduction is
consistent with our continued efforts to reduce non-core assets and legacy
loan por tfolios.
As a result of the increased capital position and reduced risk-weighted
assets, the Tier 1 common capital ratio increased 79 bps to 8.60 percent, the
Tier 1 capital ratio increased 84 bps to 11.24 percent and Total capital
increased 111 bps to 15.77 percent in 2010. When adjusted for the impacts
of the new consolidation guidance, the growth in the ratios was more
significant.
The Tier 1 leverage ratio increased 33 bps to 7.21 percent, reflecting both
the strengthening of the capital position previously mentioned and a $62 bil-
lion reduction in adjusted quarterly average total assets including the impact
of the new consolidation guidance.
The $12.4 billion goodwill impairment charges recognized during 2010 did
not impact the regulatory capital ratios.
The table below presents the Corporation’s capital ratios and related
information at December 31, 2010 and 2009.
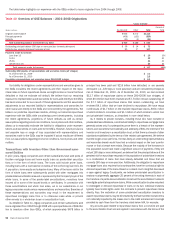
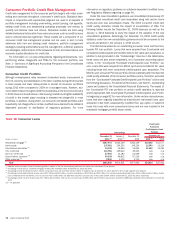
Table 12 Regulatory Capital
(Dollars in billions)
2010 2009
December 31
Tier 1 common equity ratio
8.60%
7.81%
Tier 1 capital ratio
11.24
10.40
Total capital ratio
15.77
14.66
Tier 1 leverage ratio
7.21
6.88
Risk-weighted assets
$1,456
$1,543
Adjusted quarterly average total assets
(1)
2,270
2,332
(1)
Reflects adjusted average total assets for the three months ended December 31, 2010 and 2009.
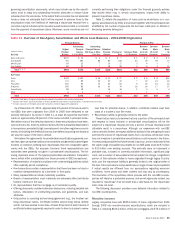
The table below presents the capital composition at December 31, 2010 and 2009.
Table 13 Capital Composition
(Dollars in millions)
2010 2009
December 31
Total common shareholders’ equity
$211,686
$194,236
Goodwill
(73,861)
(86,314)
Nonqualifying intangible assets (includes core deposit intangibles, affinity relationships, customer relationships and other intangibles)
(6,846)
(8,299)
Net unrealized gains or losses on AFS debt and marketable equity securities and net losses on derivatives recorded in accumulated OCI, net-of-tax
(4,137)
1,034
Unamortized net periodic benefit costs recorded in accumulated OCI, net-of-tax
3,947
4,092
Exclusion of fair value adjustment related to structured notes
(1)
2,984
2,981
Common Equivalent Securities
–
19,290
Disallowed deferred tax asset
(8,663)
(7,080)
Other
29
454
Total Tier 1 common capital
125,139
120,394
Preferred stock
16,562
17,964
Trust preferred securities
21,451
21,448
Noncontrolling interest
474
582
Total Tier 1 capital
163,626
160,388
Long-term debt qualifying as Tier 2 capital
41,270
43,284
Allowance for loan and lease losses
41,885
37,200
Reserve for unfunded lending commitments
1,188
1,487
Allowance for loan and lease losses exceeding 1.25 percent of risk-weighted assets
(24,690)
(18,721)
45 percent of the pre-tax net unrealized gains on AFS marketable equity securities
4,777
1,525
Other
1,538
907
Total capital
$229,594
$226,070
(1)
Represents loss on structured notes, net-of-tax, that is excluded from Tier 1 common capital, Tier 1 capital and Total capital for regulatory purposes.
Regulatory Capital Changes
In June 2004, the Basel II Accord was published by the Basel Committee on
Banking Supervision (the Basel Committee) with the intent of more closely
aligning regulatory capital requirements with underlying risks, similar to
economic capital. While economic capital is measured to cover unexpected
losses, we also manage regulatory capital to adhere to regulatory standards
of capital adequacy.
The Basel II Final Rule (Basel II) which was published in December 2007
established requirements for U.S. implementation of the Basel Committee’s
Basel II Accord and provides detailed requirements for a new regulatory
capital framework. This regulatory capital framework includes requirements
related to credit and operational risk (Pillar 1), supervisory requirements
(Pillar 2) and disclosure requirements (Pillar 3). We began the Basel II parallel
qualification period on April 1, 2010.
Designated U.S. financial institutions are required to complete a minimum
parallel qualification period under Basel II of four consecutive successful
quarters before receiving regulatory approval to report regulatory capital
using the Basel II methodology and exiting the parallel period. During the
parallel period, the resulting capital calculations under both the current risk-
based capital rules (Basel I) and Basel II will be reported to the financial
institutions’ regulatory supervisors. Once the parallel period is successfully
completed and we have received approval to exit parallel, we will transition to
Basel II as the methodology for calculating regulatory capital. Basel II provides
for a three-year transitional floor subsequent to exiting parallel, after which
Basel I may be discontinued. The Collins Amendment within the Financial
68 Bank of America 2010