Bank of America 2010 Annual Report Download - page 125
Download and view the complete annual report
Please find page 125 of the 2010 Bank of America annual report below. You can navigate through the pages in the report by either clicking on the pages listed below, or by using the keyword search tool below to find specific information within the annual report.-
 1
1 -
2
-
3
-
4
-
5
-
6
-
7
-
8
-
9
-
10
-
11
-
12
-
13
-
14
-
15
-
16
-
17
-
18
-
19
-
20
-
21
-
22
-
23
-
24
-
25
-
26
-
27
-
28
-
29
-
30
-
31
-
32
-
33
-
34
-
35
-
36
-
37
-
38
-
39
-
40
-
41
-
42
-
43
-
44
-
45
-
46
-
47
-
48
-
49
-
50
-
51
-
52
-
53
-
54
-
55
-
56
-
57
-
58
-
59
-
60
-
61
-
62
-
63
-
64
-
65
-
66
-
67
-
68
-
69
-
70
-
71
-
72
-
73
-
74
-
75
-
76
-
77
-
78
-
79
-
80
-
81
-
82
-
83
-
84
-
85
-
86
-
87
-
88
-
89
-
90
-
91
-
92
-
93
-
94
-
95
-
96
-
97
-
98
-
99
-
100
-
101
-
102
-
103
-
104
-
105
-
106
-
107
-
108
-
109
-
110
-
111
-
112
-
113
-
114
-
 115
115 -
 116
116 -
 117
117 -
 118
118 -
 119
119 -
 120
120 -
 121
121 -
 122
122 -
 123
123 -
 124
124 -
 125
125 -
 126
126 -
 127
127 -
 128
128 -
 129
129 -
 130
130 -
 131
131 -
 132
132 -
 133
133 -
 134
134 -
 135
135 -
136
-
137
-
138
-
139
-
140
-
141
-
142
-
143
-
144
-
145
-
146
-
147
-
148
-
149
-
150
-
151
-
152
-
153
-
154
-
155
-
156
-
157
-
158
-
159
-
160
-
161
-
162
-
163
-
164
-
165
-
166
-
167
-
168
-
169
-
170
-
171
-
172
-
173
-
174
-
175
-
176
-
177
-
178
-
179
-
180
-
181
-
182
-
183
-
184
-
185
-
186
-
187
-
188
-
189
-
190
-
191
-
192
-
193
-
194
-
195
-
196
-
197
-
198
-
199
-
200
-
201
-
202
-
203
-
204
-
205
-
206
-
207
-
208
-
209
-
210
-
211
-
212
-
213
-
214
-
215
-
216
-
217
-
218
-
219
-
220
-
221
-
222
-
223
-
224
-
225
-
226
-
227
-
228
-
229
-
230
-
231
-
232
-
233
-
234
-
235
-
236
-
237
-
238
-
239
-
240
-
241
-
242
-
243
-
244
-
245
-
246
-
247
-
248
-
249
-
250
-
251
-
252
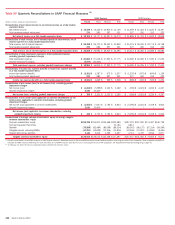
 |
 |

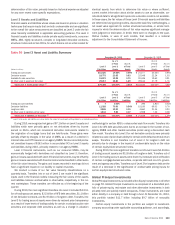
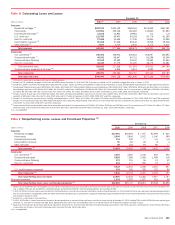
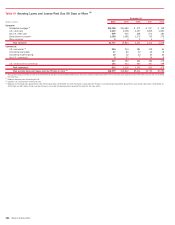
Table IV Outstanding Loans and Leases
(Dollars in millions)
2010
(1)
2009 2008 2007 2006
December 31
Consumer
Residential mortgage
(2)
$257,973
$242,129 $248,063 $274,949 $241,181
Home equity
137,981
149,126 152,483 114,820 87,893
Discontinued real estate
(3)
13,108
14,854 19,981 n/a n/a
U.S. credit card
113,785
49,453 64,128 65,774 61,195
Non-U.S. credit card
27,465
21,656 17,146 14,950 10,999
Direct/Indirect consumer
(4)
90,308
97,236 83,436 76,538 59,206
Other consumer
(5)
2,830
3,110 3,442 4,170 5,231
Total consumer
643,450
577,564 588,679 551,201 465,705
Commercial
U.S. commercial
(6)
190,305
198,903 219,233 208,297 161,982
Commercial real estate
(7)
49,393
69,447 64,701 61,298 36,258
Commercial lease financing
21,942
22,199 22,400 22,582 21,864
Non-U.S. commercial
32,029
27,079 31,020 28,376 20,681
Total commercial loans
293,669
317,628 337,354 320,553 240,785
Commercial loans measured at fair value
(8)
3,321
4,936 5,413 4,590 n/a
Total commercial
296,990
322,564 342,767 325,143 240,785
Total loans and leases
$940,440
$900,128 $931,446 $876,344 $706,490
(1)
2010 period is presented in accordance with new consolidation guidance.
(2)
Includes non-U.S. residential mortgages of $90 million and $552 million at December 31, 2010 and 2009. There were no material non-U.S. residential mortgage loans prior to January 1, 2009.
(3)
Includes $11.8 billion, $13.4 billion and $18.2 billion of pay option loans, and $1.3 billion, $1.5 billion and $1.8 billion of subprime loans at December 31, 2010, 2009 and 2008, respectively. We no longer originate these products.
(4)
Includes dealer financial services loans of $42.9 billion, $41.6 billion, $40.1 billion, $37.2 billion and $33.4 billion; consumer lending loans of $12.9 billion, $19.7 billion, $28.2 billion, $24.4 billion and $16.3 billion; U.S. securities-
based lending margin loans of $16.6 billion, $12.9 billion, $0, $0 and $0; student loans of $6.8 billion, $10.8 billion, $8.3 billion, $4.7 billion and $4.3 billion; non-U.S. consumer loans of $8.0 billion, $8.0 billion, $1.8 billion,
$3.4 billion and $3.9 billion; and other consumer loans of $3.1 billion, $4.2 billion, $5.0 billion, $6.8 billion and $1.3 billion at December 31, 2010, 2009, 2008, 2007 and 2006, respectively.
(5)
Includes consumer finance loans of $1.9 billion, $2.3 billion, $2.6 billion, $3.0 billion and $2.8 billion, other non-U.S. consumer loans of $803 million, $709 million, $618 million, $829 million and $2.3 billion, and consumer
overdrafts of $88 million, $144 million, $211 million, $320 million and $172 million at December 31, 2010, 2009, 2008, 2007 and 2006, respectively.
(6)
Includes U.S. small business commercial loans, including card-related products, of $14.7 billion, $17.5 billion, $19.1 billion, $19.3 billion and $15.2 billion at December 31, 2010, 2009, 2008, 2007 and 2006, respectively.
(7)
Includes U.S. commercial real estate loans of $46.9 billion, $66.5 billion, $63.7 billion, $60.2 billion and $35.7 billion and non-U.S. commercial real estate loans of $2.5 billion, $3.0 billion, $979 million, $1.1 billion and $578million
at December 31, 2010, 2009, 2008, 2007 and 2006, respectively.
(8)
Certain commercial loans are accounted for under the fair value option and include U.S. commercial loans of $1.6 billion, $3.0 billion, $3.5 billion and $3.5 billion, non-U.S. commercial loans of $1.7 billion, $1.9 billion, $1.7 billion
and $790 million, and commercial real estate loans of $79 million, $90 million, $203 million and $304 million at December 31, 2010, 2009, 2008 and 2007, respectively.
n/a = not applicable
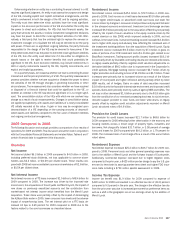
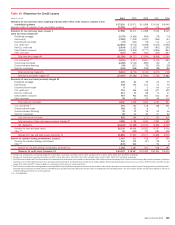
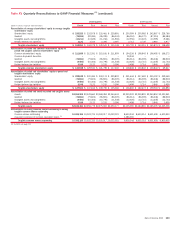
Table V Nonperforming Loans, Leases and Foreclosed Properties
(1)
(Dollars in millions)
2010 2009 2008 2007 2006
December 31
Consumer
Residential mortgage
$17,691
$16,596 $ 7,057 $1,999 $ 660
Home equity
2,694
3,804 2,637 1,340 289
Discontinued real estate
331
249 77 n/a n/a
Direct/Indirect consumer
90
86 26 8 4
Other consumer
48
104 91 95 77
Total consumer
(2)
20,854
20,839 9,888 3,442 1,030
Commercial
U.S. commercial
(3)
3,453
4,925 2,040 852 494
Commercial real estate
5,829
7,286 3,906 1,099 118
Commercial lease financing
117
115 56 33 42
Non-U.S. commercial
233
177 290 19 13
9,632
12,503 6,292 2,003 667
U.S. small business commercial
204
200 205 152 90
Total commercial
(4)
9,836
12,703 6,497 2,155 757
Total nonperforming loans and leases
30,690
33,542 16,385 5,597 1,787
Foreclosed properties
1,974
2,205 1,827 351 69
Total nonperforming loans, leases and foreclosed properties
(5)
$32,664
$35,747 $18,212 $5,948 $1,856
(1)
Balances do not include PCI loans even though the customer may be contractually past due. Loans accounted for as PCI loans were written down to fair value upon acquisition and accrete interest income over the remaining life of the
loan. In addition, FHA loans are excluded from nonperforming loans and foreclosed properties since the principal payments are insured by the FHA.
(2)
In 2010, $2.0 billion in interest income was estimated to be contractually due on consumer loans and leases classified as nonperforming at December 31, 2010 provided that these loans and leases had been paying according to
their terms and conditions, including TDRs of which $9.9 billion were performingat December 31, 2010 and not included in the table above.Approximately $514 million of the estimated $2.0 billion incontractual interestwas received
and included in earnings for 2010.
(3)
Excludes U.S. small business commercial loans.
(4)
In 2010, $429 million in interest income was estimated to be contractually due on commercial loans and leases classified as nonperforming at December 31, 2010, including TDRs of which $238 million were performing at
December 31, 2010 and not included in the table above. Approximately $76 million of the estimated $429 million in contractual interest was received and included in earnings for 2010.
(5)
Balances do not include loans accounted for under the fair value option. At December 31, 2010, there were $30 million of nonperforming loans accounted for under the fair value option. At December 31, 2010, there were $0 of loans
or leases past due 90 days or more and still accruing interest accounted for under the fair value option.
n/a = not applicable
Bank of America 2010 123