Bank of America 2010 Annual Report Download - page 176
Download and view the complete annual report
Please find page 176 of the 2010 Bank of America annual report below. You can navigate through the pages in the report by either clicking on the pages listed below, or by using the keyword search tool below to find specific information within the annual report.-
 1
1 -
2
-
3
-
4
-
5
-
6
-
7
-
8
-
9
-
10
-
11
-
12
-
13
-
14
-
15
-
16
-
17
-
18
-
19
-
20
-
21
-
22
-
23
-
24
-
25
-
26
-
27
-
28
-
29
-
30
-
31
-
32
-
33
-
34
-
35
-
36
-
37
-
38
-
39
-
40
-
41
-
42
-
43
-
44
-
45
-
46
-
47
-
48
-
49
-
50
-
51
-
52
-
53
-
54
-
55
-
56
-
57
-
58
-
59
-
60
-
61
-
62
-
63
-
64
-
65
-
66
-
67
-
68
-
69
-
70
-
71
-
72
-
73
-
74
-
75
-
76
-
77
-
78
-
79
-
80
-
81
-
82
-
83
-
84
-
85
-
86
-
87
-
88
-
89
-
90
-
91
-
92
-
93
-
94
-
95
-
96
-
97
-
98
-
99
-
100
-
101
-
102
-
103
-
104
-
105
-
106
-
107
-
108
-
109
-
110
-
111
-
112
-
113
-
114
-
115
-
116
-
117
-
118
-
119
-
120
-
121
-
122
-
123
-
124
-
125
-
126
-
127
-
128
-
129
-
130
-
131
-
132
-
133
-
134
-
135
-
136
-
137
-
138
-
139
-
140
-
141
-
142
-
143
-
144
-
145
-
146
-
147
-
148
-
149
-
150
-
151
-
152
-
153
-
154
-
155
-
156
-
157
-
158
-
159
-
160
-
161
-
162
-
163
-
164
-
165
-
 166
166 -
 167
167 -
 168
168 -
 169
169 -
 170
170 -
 171
171 -
 172
172 -
 173
173 -
 174
174 -
 175
175 -
 176
176 -
 177
177 -
 178
178 -
 179
179 -
 180
180 -
 181
181 -
 182
182 -
 183
183 -
 184
184 -
 185
185 -
 186
186 -
187
-
188
-
189
-
190
-
191
-
192
-
193
-
194
-
195
-
196
-
197
-
198
-
199
-
200
-
201
-
202
-
203
-
204
-
205
-
206
-
207
-
208
-
209
-
210
-
211
-
212
-
213
-
214
-
215
-
216
-
217
-
218
-
219
-
220
-
221
-
222
-
223
-
224
-
225
-
226
-
227
-
228
-
229
-
230
-
231
-
232
-
233
-
234
-
235
-
236
-
237
-
238
-
239
-
240
-
241
-
242
-
243
-
244
-
245
-
246
-
247
-
248
-
249
-
250
-
251
-
252
 |
 |

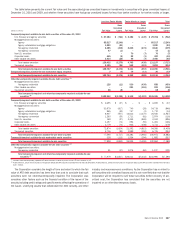
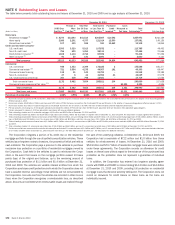
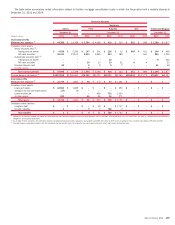
The following tables provide detailed information on the Corporation’s primary
modification programs for the renegotiated portfolio. At December 31, 2010, all
renegotiated credit card and other consumer loans were considered impaired and
have a related allowance as shown in the table below. The allowance for credit
card loans is based on the present value of projected cash flows discounted
using the interest rate in effect prior to restructuring and prior to any risk-
based or penalty-based increase in rate.
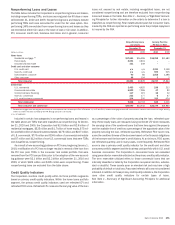
Impaired Loans – Credit Card and Other Consumer
(Dollars in millions)
Unpaid
Principal
Balance
Carrying
Value
(1)
Related
Allowance
Average
Carrying
Value
Interest
Income
Recognized
(2)
December 31, 2010 2010
With an allowance recorded
U.S. credit card
$8,680 $8,766 $3,458 $10,549 $621
Non-U.S. credit card
778 797 506 973 21
Direct/Indirect consumer
1,846 1,858 822 2,126 111
(1)
Includes accrued interest and fees.
(2)
Interest income recognized includes interest accrued and collected on the outstanding balances of accruing impaired loans as well as interest cash collections on nonaccruing impaired loans for which the ultimate collectability of
principal is not uncertain. See Note 1 – Summary of Significant Accounting Principles for additional information.
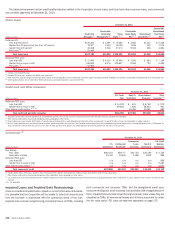
Renegotiated TDR Portfolio
(Dollars in millions)
2010 2009 2010 2009 2010 2009
2010
2009 2010 2009
December 31
Internal Programs
December 31
External Programs
December 31
Other
December 31
Total
December 31
Percent of Balances
Current or
Less Than 30 Days
Past Due
Credit card and other consumer
U.S. credit card
$6,592
$3,159
$1,927
$758
$247
$283
$8,766
$4,200
77.66%
75.43%
Non-U.S. credit card
282
252
176
168
339
435
797
855
58.86
53.02
Direct/Indirect consumer
1,222
1,414
531
539
105
89
1,858
2,042
78.81
75.44
Other consumer
–
54
–
69
–
17
–
140
n/a
68.94
Total consumer
8,096
4,879
2,634
1,534
691
824
11,421
7,237
76.51
72.66
Commercial
U.S. small business commercial
624
776
58
57
6
11
688
844
65.37
64.90
Total commercial
624
776
58
57
6
11
688
844
65.37
64.90
Total renegotiated TDR loans
$8,720
$5,655
$2,692
$1,591
$697
$835
$12,109
$8,081
75.90%
72.96%
n/a = not applicable
At December 31, 2010 and 2009, the Corporation had a renegotiated TDR
portfolio of $12.1 billion and $8.1 billion of which $9.2 billion was current or
less than 30 days past due under the modified terms at December 31, 2010.
The renegotiated TDR portfolio is excluded from nonperforming loans as the
Corporation generally does not classify consumer loans not secured by real
estate as nonperforming as these loans are generally charged off no later than
the end of the month in which the loan becomes 180 days past due. Current
period amounts include the impact of new consolidation guidance which re-
sulted in the consolidation of credit card and certain other securitization trusts.
174 Bank of America 2010