Bank of America 2010 Annual Report Download - page 195
Download and view the complete annual report
Please find page 195 of the 2010 Bank of America annual report below. You can navigate through the pages in the report by either clicking on the pages listed below, or by using the keyword search tool below to find specific information within the annual report.-
 1
1 -
2
-
3
-
4
-
5
-
6
-
7
-
8
-
9
-
10
-
11
-
12
-
13
-
14
-
15
-
16
-
17
-
18
-
19
-
20
-
21
-
22
-
23
-
24
-
25
-
26
-
27
-
28
-
29
-
30
-
31
-
32
-
33
-
34
-
35
-
36
-
37
-
38
-
39
-
40
-
41
-
42
-
43
-
44
-
45
-
46
-
47
-
48
-
49
-
50
-
51
-
52
-
53
-
54
-
55
-
56
-
57
-
58
-
59
-
60
-
61
-
62
-
63
-
64
-
65
-
66
-
67
-
68
-
69
-
70
-
71
-
72
-
73
-
74
-
75
-
76
-
77
-
78
-
79
-
80
-
81
-
82
-
83
-
84
-
85
-
86
-
87
-
88
-
89
-
90
-
91
-
92
-
93
-
94
-
95
-
96
-
97
-
98
-
99
-
100
-
101
-
102
-
103
-
104
-
105
-
106
-
107
-
108
-
109
-
110
-
111
-
112
-
113
-
114
-
115
-
116
-
117
-
118
-
119
-
120
-
121
-
122
-
123
-
124
-
125
-
126
-
127
-
128
-
129
-
130
-
131
-
132
-
133
-
134
-
135
-
136
-
137
-
138
-
139
-
140
-
141
-
142
-
143
-
144
-
145
-
146
-
147
-
148
-
149
-
150
-
151
-
152
-
153
-
154
-
155
-
156
-
157
-
158
-
159
-
160
-
161
-
162
-
163
-
164
-
165
-
166
-
167
-
168
-
169
-
170
-
171
-
172
-
173
-
174
-
175
-
176
-
177
-
178
-
179
-
180
-
181
-
182
-
183
-
184
-
 185
185 -
 186
186 -
 187
187 -
 188
188 -
 189
189 -
 190
190 -
 191
191 -
 192
192 -
 193
193 -
 194
194 -
 195
195 -
 196
196 -
 197
197 -
 198
198 -
 199
199 -
 200
200 -
 201
201 -
 202
202 -
 203
203 -
 204
204 -
 205
205 -
206
-
207
-
208
-
209
-
210
-
211
-
212
-
213
-
214
-
215
-
216
-
217
-
218
-
219
-
220
-
221
-
222
-
223
-
224
-
225
-
226
-
227
-
228
-
229
-
230
-
231
-
232
-
233
-
234
-
235
-
236
-
237
-
238
-
239
-
240
-
241
-
242
-
243
-
244
-
245
-
246
-
247
-
248
-
249
-
250
-
251
-
252
 |
 |

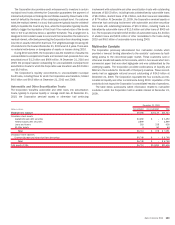
NOTE 11 Deposits
The Corporation had U.S. certificates of deposit and other U.S. time deposits of $100 thousand or more totaling $60.5 billion and $99.4 billion at December 31,
2010 and 2009. Non-U.S. certificates of deposit and other non-U.S. time deposits of $100 thousand or more totaled $64.9 billion and $67.2 billion at
December 31, 2010 and 2009. The table below presents the contractual maturities for time deposits of $100 thousand or more at December 31, 2010.
Time deposits of $100 thousand or more
(Dollars in millions)
Three months
or Less
Over Three
Months to
Twelve Months Thereafter Total
U.S. certificates of deposit and other time deposits $21,486 $29,097 $9,954
$60,537
Non-U.S. certificates of deposit and other time deposits 61,717 2,559 660
64,936
The scheduled contractual maturities for total time deposits at December 31, 2010 are presented in the table below.
(Dollars in millions)
U.S. Non-U.S. Total
Due in 2011 $110,176 $71,104
$181,280
Due in 2012 12,853 150
13,003
Due in 2013 4,426 119
4,545
Due in 2014 2,944 14
2,958
Due in 2015 1,793 1
1,794
Thereafter 4,091 87
4,178
Total time deposits
$136,283 $71,475
$207,758
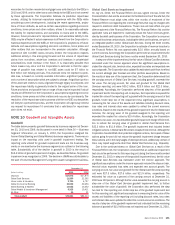
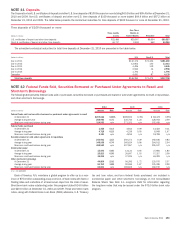
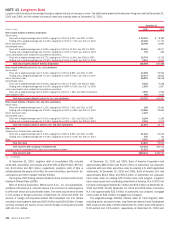
NOTE 12 Federal Funds Sold, Securities Borrowed or Purchased Under Agreements to Resell and
Short-term Borrowings
The following table presents federal funds sold or purchased, securities borrowed or purchased and loaned or sold under agreements to resell or repurchase,
and other short-term borrowings.
(Dollars in millions)
Amount Rate Amount Rate Amount Rate
2010 2009 2008
Federal funds sold and securities borrowed or purchased under agreements to resell
At December 31
$209,616 0.85%
$189,933 0.78% $ 82,478 0.95%
Average during the year
256,943 0.71
235,764 1.23 128,053 2.59
Maximum month-end balance during year
314,932 n/a
271,321 n/a 152,436 n/a
Federal funds purchased
At December 31
1,458 0.14
4,814 0.09 14,432 0.11
Averageduringyear
4,718 0.15
4,239 0.05 8,969 1.67
Maximum month-end balance during year
8,320 n/a
4,814 n/a 18,788 n/a
Securities loaned or sold under agreements to repurchase
At December 31
243,901 1.15
250,371 0.39 192,166 0.84
Averageduringyear
348,936 0.74
365,624 0.96 264,012 2.54
Maximum month-end balance during year
458,532 n/a
407,967 n/a 295,537 n/a
Commercial paper
At December 31
15,093 0.65
13,131 0.65 37,986 1.80
Averageduringyear
25,923 0.56
26,697 1.03 57,337 3.09
Maximum month-end balance during year
36,236 n/a
37,025 n/a 65,399 n/a
Other short-term borrowings
At December 31
44,869 2.02
56,393 1.72 120,070 2.07
Averageduringyear
50,752 1.88
92,084 1.87 125,385 2.99
Maximum month-end balance during year
63,081 n/a
169,602 n/a 160,150 n/a
n/a = not applicable
Bank of America, N.A. maintains a global program to offer up to a max-
imum of $75.0 billion outstanding at any one time, of bank notes with fixed or
floating rates and maturities of at least seven days from the date of issue.
Short-term bank notes outstanding under this program totaled $14.6 billion
and $20.6 billion at December 31, 2010 and 2009. These short-term bank
notes, along with Federal Home Loan Bank (FHLB) advances, U.S. Treasury
tax and loan notes, and term federal funds purchased, are included in
commercial paper and other short-term borrowings on the Consolidated
Balance Sheet. See Note 13 – Long-term Debt for information regarding
the long-term notes that may be issued under the $75.0 billion bank note
program.
Bank of America 2010 193