Bank of America 2010 Annual Report Download - page 84
Download and view the complete annual report
Please find page 84 of the 2010 Bank of America annual report below. You can navigate through the pages in the report by either clicking on the pages listed below, or by using the keyword search tool below to find specific information within the annual report.-
 1
1 -
2
-
3
-
4
-
5
-
6
-
7
-
8
-
9
-
10
-
11
-
12
-
13
-
14
-
15
-
16
-
17
-
18
-
19
-
20
-
21
-
22
-
23
-
24
-
25
-
26
-
27
-
28
-
29
-
30
-
31
-
32
-
33
-
34
-
35
-
36
-
37
-
38
-
39
-
40
-
41
-
42
-
43
-
44
-
45
-
46
-
47
-
48
-
49
-
50
-
51
-
52
-
53
-
54
-
55
-
56
-
57
-
58
-
59
-
60
-
61
-
62
-
63
-
64
-
65
-
66
-
67
-
68
-
69
-
70
-
71
-
72
-
73
-
 74
74 -
 75
75 -
 76
76 -
 77
77 -
 78
78 -
 79
79 -
 80
80 -
 81
81 -
 82
82 -
 83
83 -
 84
84 -
 85
85 -
 86
86 -
 87
87 -
 88
88 -
 89
89 -
 90
90 -
 91
91 -
 92
92 -
 93
93 -
 94
94 -
95
-
96
-
97
-
98
-
99
-
100
-
101
-
102
-
103
-
104
-
105
-
106
-
107
-
108
-
109
-
110
-
111
-
112
-
113
-
114
-
115
-
116
-
117
-
118
-
119
-
120
-
121
-
122
-
123
-
124
-
125
-
126
-
127
-
128
-
129
-
130
-
131
-
132
-
133
-
134
-
135
-
136
-
137
-
138
-
139
-
140
-
141
-
142
-
143
-
144
-
145
-
146
-
147
-
148
-
149
-
150
-
151
-
152
-
153
-
154
-
155
-
156
-
157
-
158
-
159
-
160
-
161
-
162
-
163
-
164
-
165
-
166
-
167
-
168
-
169
-
170
-
171
-
172
-
173
-
174
-
175
-
176
-
177
-
178
-
179
-
180
-
181
-
182
-
183
-
184
-
185
-
186
-
187
-
188
-
189
-
190
-
191
-
192
-
193
-
194
-
195
-
196
-
197
-
198
-
199
-
200
-
201
-
202
-
203
-
204
-
205
-
206
-
207
-
208
-
209
-
210
-
211
-
212
-
213
-
214
-
215
-
216
-
217
-
218
-
219
-
220
-
221
-
222
-
223
-
224
-
225
-
226
-
227
-
228
-
229
-
230
-
231
-
232
-
233
-
234
-
235
-
236
-
237
-
238
-
239
-
240
-
241
-
242
-
243
-
244
-
245
-
246
-
247
-
248
-
249
-
250
-
251
-
252
 |
 |

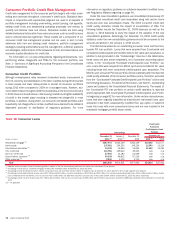
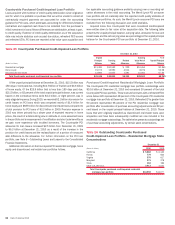
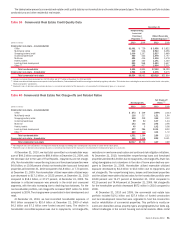
Countrywide Purchased Credit-impaired Loan Portfolio
Loans acquired with evidence of credit quality deterioration since origination
and for which it is probable at purchase that we will be unable to collect all
contractually required payments are accounted for under the accounting
guidance for PCI loans, which addresses accounting for differences between
contractual and expected cash flows to be collected from the purchaser’s
initial investment in loans if those differences are attributable, at least in part,
to credit quality. Evidence of credit quality deterioration as of the acquisition
date may include statistics such as past due status, refreshed FICO scores
and refreshed LTVs. PCI loans are recorded at fair value upon acquisition and
the applicable accounting guidance prohibits carrying over or recording val-
uation allowances in the initial accounting. The Merrill Lynch PCI consumer
loan portfolio did not materially alter the reported credit quality statistics of
the consumer portfolios. As such, the Merrill Lynch consumer PCI loans are
excluded from the following discussion and credit statistics.
Acquired loans from Countrywide that were considered credit-impaired
were written down to fair value at the acquisition date. The following table
presents the unpaid principal balance, carrying value, allowance for loan and
lease losses and the net carrying value as a percentage of the unpaid principal
balance for the Countrywide PCI loan portfolio at December 31, 2010.
Table 25 Countrywide Purchased Credit-impaired Loan Portfolio
(Dollars in millions)
Unpaid
Principal
Balance
Carrying
Value
Related
Allowance
Carrying
Value Net of
Allowance
%of
Unpaid Principal
Balance
December 31, 2010
Residential mortgage $11,481 $10,592 $ 229 $10,363 90.26%
Home equity 15,072 12,590 4,514 8,076 53.58
Discontinued real estate 14,893 11,652 1,591 10,061 67.56
Total Countrywide purchased credit-impaired loan portfolio $41,446 $34,834 $6,334 $28,500 68.76%
Of the unpaid principal balance at December 31, 2010, $15.5 billion was
180 days or more past due, including $10.9 billion of first-lien and $4.6 billion
of home equity. Of the $25.9 billion that is less than 180 days past due,
$21.5 billion, or 83 percent of the total unpaid principal balance, was current
based on the contractual terms while $2.2 billion, or eight percent, was in
early stage delinquency. During 2010, we recorded $2.3 billion of provision for
credit losses on PCI loans which was comprised mainly of $1.4 billion for
home equity and $689 million for discontinued real estate loans compared to
a total provision for PCI loans of $3.3 billion in 2009. Provision expense in
2010 was driven primarily by a slower pace of expected recovery in home
prices, the result of a deteriorating view on defaults on more seasoned loans
in the portfolio and a reassessment of modification and short sale benefits as
we gain more experience with troubled borrowers. The Countrywide PCI
allowance for loan losses increased $2.5 billion from December 31, 2009
to $6.3 billion at December 31, 2010 as a result of the increase in the
provision for credit losses and the reclassification of a portion of nonaccret-
able difference to the allowance. For further information on the PCI loan
portfolio, see Note 6 – Outstanding Loans and Leases to the Consolidated
Financial Statements.
Additional information on the Countrywide PCI residential mortgage, home
equity and discontinued real estate loan portfolios follows.
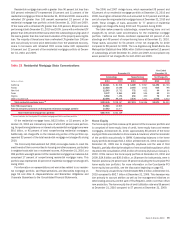
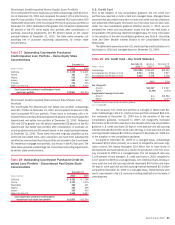
Purchased Credit-impaired Residential Mortgage Loan Portfolio
The Countrywide PCI residential mortgage loan portfolio outstandings were
$10.6 billion at December 31, 2010 and comprised 30 percent of the total
Countrywide PCI loan portfolio. Those loans to borrowers with a refreshed FICO
score below 620 represented 38 percent of the Countrywide PCI residential
mortgage loan portfolio at December 31, 2010. Refreshed LTVs greater than
90 percent represented 68 percent of the PCI residential mortgage loan
portfolio after consideration of purchase accounting adjustments and 82 per-
cent based on the unpaid principal balance at December 31, 2010. Those
loans that were originally classified as discontinued real estate loans upon
acquisition and have been subsequently modified are now included in the
residential mortgage outstandings. The table below presents outstandings net
of purchase accounting adjustments, by certain state concentrations.
Table 26 Outstanding Countrywide Purchased
Credit-impaired Loan Portfolio – Residential Mortgage State
Concentrations
(Dollars in millions)
2010 2009
December 31
California
$5,882
$6,142
Florida
779
843
Virginia
579
617
Maryland
271
278
Texas
164
166
Other U.S./Non-U.S.
2,917
3,031
Total Countrywide purchased credit-impaired residential
mortgage loan portfolio
$10,592
$11,077
82 Bank of America 2010