Bank of America 2010 Annual Report Download - page 43
Download and view the complete annual report
Please find page 43 of the 2010 Bank of America annual report below. You can navigate through the pages in the report by either clicking on the pages listed below, or by using the keyword search tool below to find specific information within the annual report.-
 1
1 -
2
-
3
-
4
-
5
-
6
-
7
-
8
-
9
-
10
-
11
-
12
-
13
-
14
-
15
-
16
-
17
-
18
-
19
-
20
-
21
-
22
-
23
-
24
-
25
-
26
-
27
-
28
-
29
-
30
-
31
-
32
-
 33
33 -
 34
34 -
 35
35 -
 36
36 -
 37
37 -
 38
38 -
 39
39 -
 40
40 -
 41
41 -
 42
42 -
 43
43 -
 44
44 -
 45
45 -
 46
46 -
 47
47 -
 48
48 -
 49
49 -
 50
50 -
 51
51 -
 52
52 -
 53
53 -
54
-
55
-
56
-
57
-
58
-
59
-
60
-
61
-
62
-
63
-
64
-
65
-
66
-
67
-
68
-
69
-
70
-
71
-
72
-
73
-
74
-
75
-
76
-
77
-
78
-
79
-
80
-
81
-
82
-
83
-
84
-
85
-
86
-
87
-
88
-
89
-
90
-
91
-
92
-
93
-
94
-
95
-
96
-
97
-
98
-
99
-
100
-
101
-
102
-
103
-
104
-
105
-
106
-
107
-
108
-
109
-
110
-
111
-
112
-
113
-
114
-
115
-
116
-
117
-
118
-
119
-
120
-
121
-
122
-
123
-
124
-
125
-
126
-
127
-
128
-
129
-
130
-
131
-
132
-
133
-
134
-
135
-
136
-
137
-
138
-
139
-
140
-
141
-
142
-
143
-
144
-
145
-
146
-
147
-
148
-
149
-
150
-
151
-
152
-
153
-
154
-
155
-
156
-
157
-
158
-
159
-
160
-
161
-
162
-
163
-
164
-
165
-
166
-
167
-
168
-
169
-
170
-
171
-
172
-
173
-
174
-
175
-
176
-
177
-
178
-
179
-
180
-
181
-
182
-
183
-
184
-
185
-
186
-
187
-
188
-
189
-
190
-
191
-
192
-
193
-
194
-
195
-
196
-
197
-
198
-
199
-
200
-
201
-
202
-
203
-
204
-
205
-
206
-
207
-
208
-
209
-
210
-
211
-
212
-
213
-
214
-
215
-
216
-
217
-
218
-
219
-
220
-
221
-
222
-
223
-
224
-
225
-
226
-
227
-
228
-
229
-
230
-
231
-
232
-
233
-
234
-
235
-
236
-
237
-
238
-
239
-
240
-
241
-
242
-
243
-
244
-
245
-
246
-
247
-
248
-
249
-
250
-
251
-
252
 |
 |

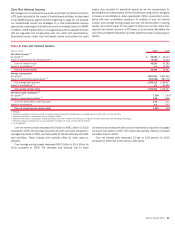
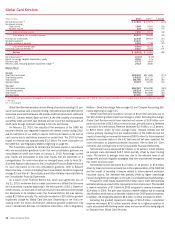
Core Net Interest Income
We manage core net interest income which is reported net interest income on
a FTE basis adjusted for the impact of market-based activities. As discussed
in the GBAM business segment section beginning on page 49, we evaluate
our market-based results and strategies on a total market-based revenue
approach by combining net interest income and noninterest income for GBAM.
In addition, 2009 is presented on a managed basis which is adjusted for loans
that we originated and subsequently sold into credit card securitizations.
Noninterest income, rather than net interest income and provision for credit
losses, was recorded for securitized assets as we are compensated for
servicing the securitized assets and we recorded servicing income and gains
or losses on securitizations, where appropriate. 2010 is presented in accor-
dance with new consolidation guidance. An analysis of core net interest
income, core average earning assets and core net interest yield on earning
assets, all of which adjust for the impact of these two non-core items from
reported net interest income on a FTE basis, is shown below. We believe the
use of this non-GAAP presentation provides additional clarity in assessing our
results.
Table 8 Core Net Interest Income
(Dollars in millions)
2010 2009
Net interest income
(1)
As reported
(2)
$52,693
$48,410
Impact of market-based net interest income
(3)
(4,430)
(6,117)
Core net interest income
48,263
42,293
Impact of securitizations
(4)
n/a
10,524
Core net interest income
48,263
52,817
Average earning assets
As reported
1,897,573
1,830,193
Impact of market-based earning assets
(3)
(504,360)
(481,376)
Core average earning assets
1,393,213
1,348,817
Impact of securitizations
(5)
n/a
83,640
Core average earning assets
1,393,213
1,432,457
Net interest yield contribution
(1)
As reported
(2)
2.78%
2.65%
Impact of market-based activities
(3)
0.68
0.49
Core net interest yield on earning assets
3.46
3.14
Impact of securitizations
n/a
0.55
Core net interest yield on earning assets
3.46%
3.69%
(1)
FTE basis
(2)
Balance and calculation include fees earned on overnight deposits placed with the Federal Reserve of $368 million and $379 million for 2010 and 2009.
(3)
Represents the impact of market-based amounts included in GBAM.
(4)
Represents the impact of securitizations utilizing actual bond costs which is different from the business segment view which utilizes funds transfer pricing methodologies.
(5)
Represents average securitized loans less accrued interest receivable and certain securitized bonds retained.
n/a = not applicable
Core net interest income decreased $4.6 billion to $48.3 billion for 2010
compared to 2009. The decrease was driven by lower loan levels compared to
managed loan levels in 2009, and lower yields for the discretionary and credit
card portfolios. These impacts were partially offset by lower rates on
deposits.
Core average earning assets decreased $39.2 billion to $1.4 trillion for
2010 compared to 2009. The decrease was primarily due to lower
commercial loan levels and lower consumer loan levels compared to managed
consumer loan levels in 2009. The impact was partially offset by increased
securities levels in 2010.
Core net interest yield decreased 23 bps to 3.46 percent for 2010
compared to 2009 due to the factors noted above.
Bank of America 2010 41