Bank of America 2010 Annual Report Download - page 89
Download and view the complete annual report
Please find page 89 of the 2010 Bank of America annual report below. You can navigate through the pages in the report by either clicking on the pages listed below, or by using the keyword search tool below to find specific information within the annual report.-
 1
1 -
2
-
3
-
4
-
5
-
6
-
7
-
8
-
9
-
10
-
11
-
12
-
13
-
14
-
15
-
16
-
17
-
18
-
19
-
20
-
21
-
22
-
23
-
24
-
25
-
26
-
27
-
28
-
29
-
30
-
31
-
32
-
33
-
34
-
35
-
36
-
37
-
38
-
39
-
40
-
41
-
42
-
43
-
44
-
45
-
46
-
47
-
48
-
49
-
50
-
51
-
52
-
53
-
54
-
55
-
56
-
57
-
58
-
59
-
60
-
61
-
62
-
63
-
64
-
65
-
66
-
67
-
68
-
69
-
70
-
71
-
72
-
73
-
74
-
75
-
76
-
77
-
78
-
 79
79 -
 80
80 -
 81
81 -
 82
82 -
 83
83 -
 84
84 -
 85
85 -
 86
86 -
 87
87 -
 88
88 -
 89
89 -
 90
90 -
 91
91 -
 92
92 -
 93
93 -
 94
94 -
 95
95 -
 96
96 -
 97
97 -
 98
98 -
 99
99 -
100
-
101
-
102
-
103
-
104
-
105
-
106
-
107
-
108
-
109
-
110
-
111
-
112
-
113
-
114
-
115
-
116
-
117
-
118
-
119
-
120
-
121
-
122
-
123
-
124
-
125
-
126
-
127
-
128
-
129
-
130
-
131
-
132
-
133
-
134
-
135
-
136
-
137
-
138
-
139
-
140
-
141
-
142
-
143
-
144
-
145
-
146
-
147
-
148
-
149
-
150
-
151
-
152
-
153
-
154
-
155
-
156
-
157
-
158
-
159
-
160
-
161
-
162
-
163
-
164
-
165
-
166
-
167
-
168
-
169
-
170
-
171
-
172
-
173
-
174
-
175
-
176
-
177
-
178
-
179
-
180
-
181
-
182
-
183
-
184
-
185
-
186
-
187
-
188
-
189
-
190
-
191
-
192
-
193
-
194
-
195
-
196
-
197
-
198
-
199
-
200
-
201
-
202
-
203
-
204
-
205
-
206
-
207
-
208
-
209
-
210
-
211
-
212
-
213
-
214
-
215
-
216
-
217
-
218
-
219
-
220
-
221
-
222
-
223
-
224
-
225
-
226
-
227
-
228
-
229
-
230
-
231
-
232
-
233
-
234
-
235
-
236
-
237
-
238
-
239
-
240
-
241
-
242
-
243
-
244
-
245
-
246
-
247
-
248
-
249
-
250
-
251
-
252
 |
 |

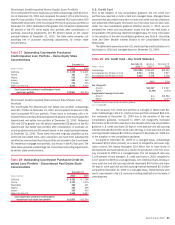
Commercial Portfolio Credit Risk Management
Credit risk management for the commercial portfolio begins with an assess-
ment of the credit risk profile of the borrower or counterparty based on an
analysis of its financial position. As part of the overall credit risk assessment,
our commercial credit exposures are assigned a risk rating and are subject to
approval based on defined credit approval standards. Subsequent to loan
origination, risk ratings are monitored on an ongoing basis, and if necessary,
adjusted to reflect changes in the financial condition, cash flow, risk profile, or
outlook of a borrower or counterparty. In making credit decisions, we consider
risk rating, collateral, country, industry and single name concentration limits
while also balancing the total borrower or counterparty relationship. Our lines
of business and risk management personnel use a variety of tools to contin-
uously monitor the ability of a borrower or counterparty to perform under its
obligations. We use risk rating aggregations to measure and evaluate con-
centrations within portfolios. In addition, risk ratings are a factor in determin-
ing the level of assigned economic capital and the allowance for credit losses.
For information on our accounting policies regarding delinquencies, non-
performing status and net charge-offs for the commercial portfolio, refer to
Note 1 – Summary of Significant Accounting Principles to the Consolidated
Financial Statements.
Management of Commercial Credit Risk Concentrations
Commercial credit risk is evaluated and managed with the goal that concen-
trations of credit exposure do not result in undesirable levels of risk. We
review, measure and manage concentrations of credit exposure by industry,
product, geography, customer relationship and loan size. We also review,
measure and manage commercial real estate loans by geographic location
and property type. In addition, within our international portfolio, we evaluate
exposures by region and by country. Tables 38, 42, 48 and 49 summarize our
concentrations. We also utilize syndication of exposure to third parties, loan
sales, hedging and other risk mitigation techniques to manage the size and
risk profile of the commercial credit portfolio.
As part of our ongoing risk mitigation initiatives, we attempt to work with
clients to modify their loans to terms that better align with their current ability
to pay. In situations where an economic concession has been granted to a
borrower experiencing financial difficulty, we identify these loans as TDRs.
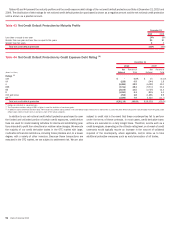
We account for certain large corporate loans and loan commitments,
including issued but unfunded letters of credit which are considered utilized
for credit risk management purposes, that exceed our single name credit risk
concentration guidelines under the fair value option. Lending commitments,
both funded and unfunded, are actively managed and monitored, and as
appropriate, credit risk for these lending relationships may be mitigated
through the use of credit derivatives, with the Corporation’s credit view and
market perspectives determining the size and timing of the hedging activity. In
addition, we purchase credit protection to cover the funded portion as well as
the unfunded portion of certain other credit exposures. To lessen the cost of
obtaining our desired credit protection levels, credit exposure may be added
within an industry, borrower or counterparty group by selling protection. These
credit derivatives do not meet the requirements for treatment as accounting
hedges. They are carried at fair value with changes in fair value recorded in
other income (loss).
Commercial Credit Portfolio
U.S.-basedloanbalancescontinuedtodeclineonweakloandemandas
businesses aggressively managed their working capital and production ca-
pacity by maintaining lean inventories, staff levels, physical locations and
capital expenditures. Additionally, many borrowers continued to access the
capital markets for financing while reducing their use of bank credit facilities.
Risk mitigation strategies and net charge-offs further contributed to the
decline in loan balances. Fourth-quarter balances showed stabilization rela-
tive to prior quarters. Non-U.S. commercial loans showed strong growth from
client demand, driven by regional economic conditions and the positive impact
of our initiatives in Asia and other emerging markets.
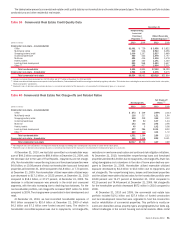
Reservable criticized balances, net charge-offs and nonperforming loans,
leases and foreclosed property balances in the commercial credit portfolio
declined in 2010. These reductions were driven primarily by the U.S. com-
mercial and commercial real estate portfolios. U.S. commercial was driven by
broad-based improvements in terms of clients, industries and lines of busi-
ness. Commercial real estate also continued to show signs of stabilization
during 2010; however, levels of stressed commercial real estate loans
remained elevated. Most other credit indicators across the remaining com-
mercial portfolio have also improved.
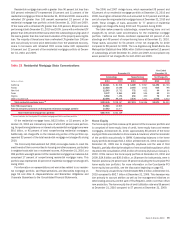
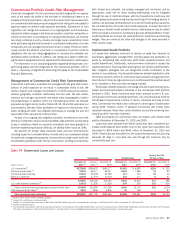
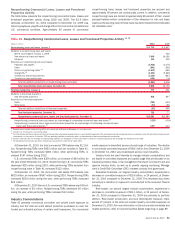
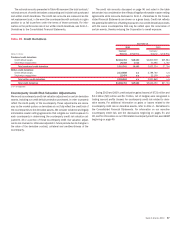
Table 34 presents our commercial loans and leases, and related credit
quality information at December 31, 2010 and 2009.
Loans that were acquired from Merrill Lynch that were considered pur-
chased credit-impaired were written down to fair value upon acquisition and
amounted to $204 million and $692 million at December 31, 2010 and
2009. These loans are excluded from the nonperforming loans and accruing
balances 90 days or more past due even though the customer may be
contractually past due.
Table 34 Commercial Loans and Leases
(Dollars in millions)
December 31
2010
(1)
January 1
2010
(1)
December 31
2009
December 31
2010
December 31
2009
December 31
2010
December 31
2009
Outstandings Nonperforming
Accruing Past Due
90 Days or More
U.S. commercial
(2)
$175,586
$186,675 $181,377
$3,453
$4,925
$236
$213
Commercial real estate
(3)
49,393
69,377 69,447
5,829
7,286
47
80
Commercial lease financing
21,942
22,199 22,199
117
115
18
32
Non-U.S. commercial
32,029
27,079 27,079
233
177
6
67
278,950
305,330 300,102
9,632
12,503
307
392
U.S. small business commercial
(4)
14,719
17,526 17,526
204
200
325
624
Total commercial loans excluding loans measured at fair value
293,669
322,856 317,628
9,836
12,703
632
1,016
Total measured at fair value
(5)
3,321
4,936 4,936
30
138
–
87
Total commercial loans and leases
$296,990
$327,792 $322,564
$9,866
$12,841
$632
$1,103
(1)
Balance reflects impact of new consolidation guidance.
(2)
Excludes U.S. small business commercial loans.
(3)
Includes U.S. commercial real estate loans of $46.9 billion and $66.5 billion and non-U.S. commercial real estate loans of $2.5 billion and $3.0 billion at December 31, 2010 and 2009.
(4)
Includes card-related products.
(5)
Commercial loans accounted for under the fair value option include U.S. commercial loans of $1.6 billion and $3.0 billion, non-U.S. commercial loans of $1.7 billion and $1.9 billion and commercial real estate loans of $79 million and
$90 million at December 31, 2010 and 2009. See Note 23 – Fair Value Option to the Consolidated Financial Statements for additional information on the fair value option.
Bank of America 2010 87