Bank of America 2010 Annual Report Download - page 228
Download and view the complete annual report
Please find page 228 of the 2010 Bank of America annual report below. You can navigate through the pages in the report by either clicking on the pages listed below, or by using the keyword search tool below to find specific information within the annual report.-
 1
1 -
2
-
3
-
4
-
5
-
6
-
7
-
8
-
9
-
10
-
11
-
12
-
13
-
14
-
15
-
16
-
17
-
18
-
19
-
20
-
21
-
22
-
23
-
24
-
25
-
26
-
27
-
28
-
29
-
30
-
31
-
32
-
33
-
34
-
35
-
36
-
37
-
38
-
39
-
40
-
41
-
42
-
43
-
44
-
45
-
46
-
47
-
48
-
49
-
50
-
51
-
52
-
53
-
54
-
55
-
56
-
57
-
58
-
59
-
60
-
61
-
62
-
63
-
64
-
65
-
66
-
67
-
68
-
69
-
70
-
71
-
72
-
73
-
74
-
75
-
76
-
77
-
78
-
79
-
80
-
81
-
82
-
83
-
84
-
85
-
86
-
87
-
88
-
89
-
90
-
91
-
92
-
93
-
94
-
95
-
96
-
97
-
98
-
99
-
100
-
101
-
102
-
103
-
104
-
105
-
106
-
107
-
108
-
109
-
110
-
111
-
112
-
113
-
114
-
115
-
116
-
117
-
118
-
119
-
120
-
121
-
122
-
123
-
124
-
125
-
126
-
127
-
128
-
129
-
130
-
131
-
132
-
133
-
134
-
135
-
136
-
137
-
138
-
139
-
140
-
141
-
142
-
143
-
144
-
145
-
146
-
147
-
148
-
149
-
150
-
151
-
152
-
153
-
154
-
155
-
156
-
157
-
158
-
159
-
160
-
161
-
162
-
163
-
164
-
165
-
166
-
167
-
168
-
169
-
170
-
171
-
172
-
173
-
174
-
175
-
176
-
177
-
178
-
179
-
180
-
181
-
182
-
183
-
184
-
185
-
186
-
187
-
188
-
189
-
190
-
191
-
192
-
193
-
194
-
195
-
196
-
197
-
198
-
199
-
200
-
201
-
202
-
203
-
204
-
205
-
206
-
207
-
208
-
209
-
210
-
211
-
212
-
213
-
214
-
215
-
216
-
217
-
 218
218 -
 219
219 -
 220
220 -
 221
221 -
 222
222 -
 223
223 -
 224
224 -
 225
225 -
 226
226 -
 227
227 -
 228
228 -
 229
229 -
 230
230 -
 231
231 -
 232
232 -
 233
233 -
 234
234 -
 235
235 -
 236
236 -
 237
237 -
 238
238 -
239
-
240
-
241
-
242
-
243
-
244
-
245
-
246
-
247
-
248
-
249
-
250
-
251
-
252
 |
 |

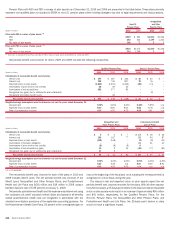
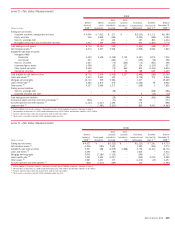
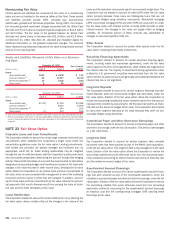
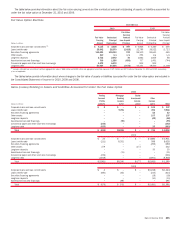
Recurring Fair Value
Assets and liabilities carried at fair value on a recurring basis at December 31, 2010 and 2009, including financial instruments which the Corporation accounts
for under the fair value option, are summarized in the following tables.
(Dollars in millions)
Level 1
(1)
Level 2
(1)
Level 3 Adjustments
(2)
at Fair Value
Fair Value Measurements Netting Assets/Liabilities
December 31, 2010
Assets
Federal funds sold and securities borrowed or purchased under agreements
to resell
$ – $ 78,599 $ – $ – $ 78,599
Trading account assets:
U.S. government and agency securities
17,647 43,164 – – 60,811
Corporate securities, trading loans and other
732 40,869 7,751 – 49,352
Equity securities
23,249 8,257 623 – 32,129
Non-U.S. sovereign debt
24,934 8,346 243 – 33,523
Mortgage trading loans and asset-backed securities
– 11,948 6,908 – 18,856
Total trading account assets
66,562 112,584 15,525 – 194,671
Derivative assets
(3)
2,627 1,516,244 18,773 (1,464,644) 73,000
Available-for-sale debt securities:
U.S. Treasury securities and agency securities
46,003 3,102 – – 49,105
Mortgage-backed securities:
Agency
– 191,213 4 – 191,217
Agency-collateralized mortgage obligations
– 37,017 – – 37,017
Non-agency residential
– 21,649 1,468 – 23,117
Non-agency commercial
– 6,833 19 – 6,852
Non-U.S. securities
1,440 2,696 3 – 4,139
Corporate/Agency bonds
– 5,154 137 – 5,291
Other taxable securities
20 2,354 13,018 – 15,392
Tax-exempt securities
– 4,273 1,224 – 5,497
Total available-for-sale debt securities
47,463 274,291 15,873 – 337,627
Loans and leases
– – 3,321 – 3,321
Mortgage servicing rights
– – 14,900 – 14,900
Loans held-for-sale
– 21,802 4,140 – 25,942
Other assets
32,624 31,051 6,856 – 70,531
Total assets
$149,276 $2,034,571 $79,388 $(1,464,644) $798,591
Liabilities
Interest-bearing deposits in U.S. offices
$ – $ 2,732 $ – $ – $ 2,732
Federal funds purchased and securities loaned or sold under agreements to
repurchase
– 37,424 – – 37,424
Trading account liabilities:
U.S. government and agency securities
23,357 5,983 – – 29,340
Equity securities
14,568 914 – – 15,482
Non-U.S. sovereign debt
14,748 1,065 – – 15,813
Corporate securities and other
224 11,119 7 – 11,350
Total trading account liabilities
52,897 19,081 7 – 71,985
Derivative liabilities
(3)
1,799 1,492,963 11,028 (1,449,876) 55,914
Commercial paper and other short-term borrowings
– 6,472 706 – 7,178
Accrued expenses and other liabilities
31,470 931 828 – 33,229
Long-term debt
– 47,998 2,986 – 50,984
Total liabilities
$ 86,166 $1,607,601 $15,555 $(1,449,876) $259,446
(1)
Gross transfers between Level 1 and Level 2 were approximately $1.3 billion during the year ended December 31, 2010.
(2)
Amounts represent the impact of legally enforceable master netting agreements and also cash collateral held or placed with the same counterparties.
(3)
For further disaggregation of derivative assets and liabilities, see Note 4 – Derivatives.
226 Bank of America 2010