Bank of America 2010 Annual Report Download - page 135
Download and view the complete annual report
Please find page 135 of the 2010 Bank of America annual report below. You can navigate through the pages in the report by either clicking on the pages listed below, or by using the keyword search tool below to find specific information within the annual report.-
 1
1 -
2
-
3
-
4
-
5
-
6
-
7
-
8
-
9
-
10
-
11
-
12
-
13
-
14
-
15
-
16
-
17
-
18
-
19
-
20
-
21
-
22
-
23
-
24
-
25
-
26
-
27
-
28
-
29
-
30
-
31
-
32
-
33
-
34
-
35
-
36
-
37
-
38
-
39
-
40
-
41
-
42
-
43
-
44
-
45
-
46
-
47
-
48
-
49
-
50
-
51
-
52
-
53
-
54
-
55
-
56
-
57
-
58
-
59
-
60
-
61
-
62
-
63
-
64
-
65
-
66
-
67
-
68
-
69
-
70
-
71
-
72
-
73
-
74
-
75
-
76
-
77
-
78
-
79
-
80
-
81
-
82
-
83
-
84
-
85
-
86
-
87
-
88
-
89
-
90
-
91
-
92
-
93
-
94
-
95
-
96
-
97
-
98
-
99
-
100
-
101
-
102
-
103
-
104
-
105
-
106
-
107
-
108
-
109
-
110
-
111
-
112
-
113
-
114
-
115
-
116
-
117
-
118
-
119
-
120
-
121
-
122
-
123
-
124
-
 125
125 -
 126
126 -
 127
127 -
 128
128 -
 129
129 -
 130
130 -
 131
131 -
 132
132 -
 133
133 -
 134
134 -
 135
135 -
 136
136 -
 137
137 -
 138
138 -
 139
139 -
 140
140 -
 141
141 -
 142
142 -
 143
143 -
 144
144 -
 145
145 -
146
-
147
-
148
-
149
-
150
-
151
-
152
-
153
-
154
-
155
-
156
-
157
-
158
-
159
-
160
-
161
-
162
-
163
-
164
-
165
-
166
-
167
-
168
-
169
-
170
-
171
-
172
-
173
-
174
-
175
-
176
-
177
-
178
-
179
-
180
-
181
-
182
-
183
-
184
-
185
-
186
-
187
-
188
-
189
-
190
-
191
-
192
-
193
-
194
-
195
-
196
-
197
-
198
-
199
-
200
-
201
-
202
-
203
-
204
-
205
-
206
-
207
-
208
-
209
-
210
-
211
-
212
-
213
-
214
-
215
-
216
-
217
-
218
-
219
-
220
-
221
-
222
-
223
-
224
-
225
-
226
-
227
-
228
-
229
-
230
-
231
-
232
-
233
-
234
-
235
-
236
-
237
-
238
-
239
-
240
-
241
-
242
-
243
-
244
-
245
-
246
-
247
-
248
-
249
-
250
-
251
-
252
 |
 |

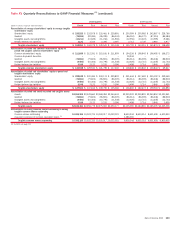
(Dollars in millions, except per share information)
Fourth Third Second First Fourth Third Second First
2010 Quarters 2009 Quarters
Reconciliation of average shareholders’ equity to average tangible
shareholders’ equity
Shareholders’ equity
$ 235,525
$ 233,978 $ 233,461 $ 229,891 $ 250,599 $ 255,983 $ 242,867 $ 228,766
Goodwill
(75,584)
(82,484) (86,099) (86,334) (86,053) (86,170) (87,314) (84,584)
Intangible assets (excluding MSRs)
(10,211)
(10,629) (11,216) (11,906) (12,556) (13,223) (13,595) (9,461)
Related deferred tax liabilities
3,121
3,214 3,395 3,497 3,712 3,725 3,916 3,977
Tangible shareholders’ equity
$ 152,851
$ 144,079 $ 139,541 $ 135,148 $ 155,702 $ 160,315 $ 145,874 $ 138,698
Reconciliation of period end common shareholders’ equity to
period end tangible common shareholders’ equity
Common shareholders’ equity
$ 211,686
$ 212,391 $ 215,181 $ 211,859 $ 194,236 $ 198,843 $ 196,492 $ 166,272
Common Equivalent Securities
–
– – – 19,244 – – –
Goodwill
(73,861)
(75,602) (85,801) (86,305) (86,314) (86,009) (86,246) (86,910)
Intangible assets (excluding MSRs)
(9,923)
(10,402) (10,796) (11,548) (12,026) (12,715) (13,245) (13,703)
Related deferred tax liabilities
3,036
3,123 3,215 3,396 3,498 3,714 3,843 3,958
Tangible common shareholders’ equity
$ 130,938
$ 129,510 $ 121,799 $ 117,402 $ 118,638 $ 103,833 $ 100,844 $ 69,617
Reconciliation of period end shareholders’ equity to period end
tangible shareholders’ equity
Shareholders’ equity
$ 228,248
$ 230,495 $ 233,174 $ 229,823 $ 231,444 $ 257,683 $ 255,152 $ 239,549
Goodwill
(73,861)
(75,602) (85,801) (86,305) (86,314) (86,009) (86,246) (86,910)
Intangible assets (excluding MSRs)
(9,923)
(10,402) (10,796) (11,548) (12,026) (12,715) (13,245) (13,703)
Related deferred tax liabilities
3,036
3,123 3,215 3,396 3,498 3,714 3,843 3,958
Tangible shareholders’ equity
$ 147,500
$ 147,614 $ 139,792 $ 135,366 $ 136,602 $ 162,673 $ 159,504 $ 142,894
Reconciliation of period end assets to period end tangible assets
Assets
$2,264,909
$2,339,660 $2,368,384 $2,344,634 $2,230,232 $2,259,891 $2,260,853 $2,321,961
Goodwill
(73,861)
(75,602) (85,801) (86,305) (86,314) (86,009) (86,246) (86,910)
Intangible assets (excluding MSRs)
(9,923)
(10,402) (10,796) (11,548) (12,026) (12,715) (13,245) (13,703)
Related deferred tax liabilities
3,036
3,123 3,215 3,396 3,498 3,714 3,843 3,958
Tangible assets
$2,184,161
$2,256,779 $2,275,002 $2,250,177 $2,135,390 $2,164,881 $2,165,205 $2,225,306
Reconciliation of ending common shares outstanding to ending
tangible common shares outstanding
Common shares outstanding
10,085,155
10,033,705 10,033,017 10,032,001 8,650,244 8,650,314 8,651,459 6,400,950
Assumed conversion of common equivalent shares
(2)
–
– – – 1,286,000 – – –
Tangible common shares outstanding
10,085,155
10,033,705 10,033,017 10,032,001 9,936,244 8,650,314 8,651,459 6,400,950
For footnotes see page 132.
Bank of America 2010 133
Table XV Quarterly Reconciliations to GAAP Financial Measures
(1)
(continued)