Bank of America 2010 Annual Report Download - page 238
Download and view the complete annual report
Please find page 238 of the 2010 Bank of America annual report below. You can navigate through the pages in the report by either clicking on the pages listed below, or by using the keyword search tool below to find specific information within the annual report.-
 1
1 -
2
-
3
-
4
-
5
-
6
-
7
-
8
-
9
-
10
-
11
-
12
-
13
-
14
-
15
-
16
-
17
-
18
-
19
-
20
-
21
-
22
-
23
-
24
-
25
-
26
-
27
-
28
-
29
-
30
-
31
-
32
-
33
-
34
-
35
-
36
-
37
-
38
-
39
-
40
-
41
-
42
-
43
-
44
-
45
-
46
-
47
-
48
-
49
-
50
-
51
-
52
-
53
-
54
-
55
-
56
-
57
-
58
-
59
-
60
-
61
-
62
-
63
-
64
-
65
-
66
-
67
-
68
-
69
-
70
-
71
-
72
-
73
-
74
-
75
-
76
-
77
-
78
-
79
-
80
-
81
-
82
-
83
-
84
-
85
-
86
-
87
-
88
-
89
-
90
-
91
-
92
-
93
-
94
-
95
-
96
-
97
-
98
-
99
-
100
-
101
-
102
-
103
-
104
-
105
-
106
-
107
-
108
-
109
-
110
-
111
-
112
-
113
-
114
-
115
-
116
-
117
-
118
-
119
-
120
-
121
-
122
-
123
-
124
-
125
-
126
-
127
-
128
-
129
-
130
-
131
-
132
-
133
-
134
-
135
-
136
-
137
-
138
-
139
-
140
-
141
-
142
-
143
-
144
-
145
-
146
-
147
-
148
-
149
-
150
-
151
-
152
-
153
-
154
-
155
-
156
-
157
-
158
-
159
-
160
-
161
-
162
-
163
-
164
-
165
-
166
-
167
-
168
-
169
-
170
-
171
-
172
-
173
-
174
-
175
-
176
-
177
-
178
-
179
-
180
-
181
-
182
-
183
-
184
-
185
-
186
-
187
-
188
-
189
-
190
-
191
-
192
-
193
-
194
-
195
-
196
-
197
-
198
-
199
-
200
-
201
-
202
-
203
-
204
-
205
-
206
-
207
-
208
-
209
-
210
-
211
-
212
-
213
-
214
-
215
-
216
-
217
-
218
-
219
-
220
-
221
-
222
-
223
-
224
-
225
-
226
-
227
-
 228
228 -
 229
229 -
 230
230 -
 231
231 -
 232
232 -
 233
233 -
 234
234 -
 235
235 -
 236
236 -
 237
237 -
 238
238 -
 239
239 -
 240
240 -
 241
241 -
 242
242 -
 243
243 -
 244
244 -
 245
245 -
 246
246 -
 247
247 -
 248
248 -
249
-
250
-
251
-
252
 |
 |

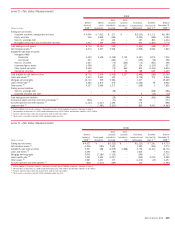
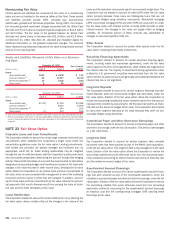
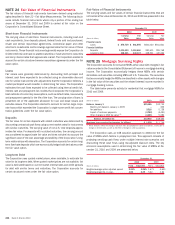
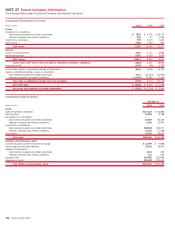
NOTE 24 Fair Value of Financial Instruments
The fair values of financial instruments have been derived using methodol-
ogies described in Note 22 – Fair Value Measurements. The following disclo-
sures include financial instruments where only a portion of the ending bal-
ances at December 31, 2010 and 2009 is carried at fair value on the
Corporation’s Consolidated Balance Sheet.
Short-term Financial Instruments
The carrying value of short-term financial instruments, including cash and
cash equivalents, time deposits placed, federal funds sold and purchased,
resale and certain repurchase agreements, commercial paper and other
short-term investments and borrowings approximates the fair value of these
instruments. These financial instruments generally expose the Corporation to
limited credit risk and have no stated maturities or have short-term maturities
and carry interest rates that approximate market. The Corporation elected to
account for certain structured reverse repurchase agreements under the fair
value option.
Loans
Fair values were generally determined by discounting both principal and
interest cash flows expected to be collected using an observable discount
rate for similar instruments with adjustments that the Corporation believes a
market participant would consider in determining fair value. The Corporation
estimates the cash flows expected to be collected using internal credit risk,
interest rate and prepayment risk models that incorporate the Corporation’s
best estimate of current key assumptions, such as default rates, loss severity
and prepayment speeds for the life of the loan. The carrying value of loans is
presented net of the applicable allowance for loan and lease losses and
excludes leases. The Corporation elected to account for certain large corpo-
rate loans which exceeded the Corporation’s single name credit risk concen-
tration guidelines under the fair value option.
Deposits
The fair value for certain deposits with stated maturities was determined by
discounting contractual cash flows using current market rates for instruments
with similar maturities. The carrying value of non-U.S. time deposits approx-
imates fair value. For deposits with no stated maturities, the carrying amount
was considered to approximate fair value and does not take into account the
significant value of the cost advantage and stability of the Corporation’s long-
term relationships with depositors. The Corporation accounts for certain long-
term fixed-rate deposits which are economically hedged with derivatives under
the fair value option.
Long-term Debt
The Corporation uses quoted market prices, when available, to estimate fair
value for its long-term debt. When quoted market prices are not available, fair
value is estimated based on current market interest rates and credit spreads
for debt with similar terms and maturities. The Corporation accounts for
certain structured notes under the fair value option.
Fair Value of Financial Instruments
The carrying values and fair values of certain financial instruments that are
not carried at fair value at December 31, 2010 and 2009 are presented in the
table below.
(Dollars in millions)
Carrying
Value
Fair
Value
Carrying
Value
Fair
Value
2010 2009
December 31
Financial assets
Loans
$ 876,739 $ 861,695
$841,020 $811,831
Financial liabilities
Deposits
1,010,430 1,010,460
991,611 991,768
Long-term debt
448,431 433,107
438,521 440,246
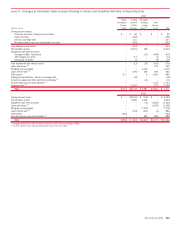
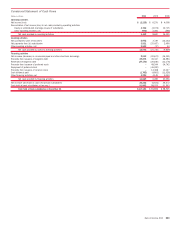
NOTE 25 Mortgage Servicing Rights
The Corporation accounts for consumer MSRs at fair value with changes in fair
value recorded in the Consolidated Statement of Income in mortgage banking
income. The Corporation economically hedges these MSRs with certain
derivatives and securities including MBS and U.S. Treasuries. The securities
that economically hedge the MSRs are classified in other assets with changes
in the fair value of the securities and the related interest income recorded in
mortgage banking income.
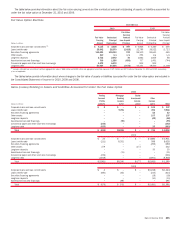
The table below presents activity for residential first mortgage MSRs for
2010 and 2009.
(Dollars in millions)
2010 2009
Balance, January 1
$19,465
$12,733
Merrill Lynch balance, January 1, 2009
–
209
Net additions
3,516
5,728
Impact of customer payments
(3,760)
(4,491)
Other changes in MSR fair value
(1)
(4,321)
5,286
Balance, December 31
$14,900
$19,465
Mortgage loans serviced for investors (in billions)
$1,628
$1,716
(1)
These amounts reflect the change in discount rates and prepayment speed assumptions, mostly due to
changes in interest rates, as well as the effect of changes in other assumptions.
The Corporation uses an OAS valuation approach to determine the fair
value of MSRs which factors in prepayment risk. This approach consists of
projecting servicing cash flows under multiple interest rate scenarios and
discounting these cash flows using risk-adjusted discount rates. The key
economic assumptions used in determining the fair value of MSRs at De-
cember 31, 2010 and 2009 are presented below.
(Dollars in millions)
Fixed Adjustable Fixed Adjustable
2010 2009
December 31
Weighted-average option adjusted spread
2.21% 3.25%
1.67% 4.64%
Weighted-average life, in years
4.85 2.29
5.62 3.26
236 Bank of America 2010