Bank of America 2010 Annual Report Download - page 108
Download and view the complete annual report
Please find page 108 of the 2010 Bank of America annual report below. You can navigate through the pages in the report by either clicking on the pages listed below, or by using the keyword search tool below to find specific information within the annual report.-
 1
1 -
2
-
3
-
4
-
5
-
6
-
7
-
8
-
9
-
10
-
11
-
12
-
13
-
14
-
15
-
16
-
17
-
18
-
19
-
20
-
21
-
22
-
23
-
24
-
25
-
26
-
27
-
28
-
29
-
30
-
31
-
32
-
33
-
34
-
35
-
36
-
37
-
38
-
39
-
40
-
41
-
42
-
43
-
44
-
45
-
46
-
47
-
48
-
49
-
50
-
51
-
52
-
53
-
54
-
55
-
56
-
57
-
58
-
59
-
60
-
61
-
62
-
63
-
64
-
65
-
66
-
67
-
68
-
69
-
70
-
71
-
72
-
73
-
74
-
75
-
76
-
77
-
78
-
79
-
80
-
81
-
82
-
83
-
84
-
85
-
86
-
87
-
88
-
89
-
90
-
91
-
92
-
93
-
94
-
95
-
96
-
97
-
 98
98 -
 99
99 -
 100
100 -
 101
101 -
 102
102 -
 103
103 -
 104
104 -
 105
105 -
 106
106 -
 107
107 -
 108
108 -
 109
109 -
 110
110 -
 111
111 -
 112
112 -
 113
113 -
 114
114 -
 115
115 -
 116
116 -
 117
117 -
 118
118 -
119
-
120
-
121
-
122
-
123
-
124
-
125
-
126
-
127
-
128
-
129
-
130
-
131
-
132
-
133
-
134
-
135
-
136
-
137
-
138
-
139
-
140
-
141
-
142
-
143
-
144
-
145
-
146
-
147
-
148
-
149
-
150
-
151
-
152
-
153
-
154
-
155
-
156
-
157
-
158
-
159
-
160
-
161
-
162
-
163
-
164
-
165
-
166
-
167
-
168
-
169
-
170
-
171
-
172
-
173
-
174
-
175
-
176
-
177
-
178
-
179
-
180
-
181
-
182
-
183
-
184
-
185
-
186
-
187
-
188
-
189
-
190
-
191
-
192
-
193
-
194
-
195
-
196
-
197
-
198
-
199
-
200
-
201
-
202
-
203
-
204
-
205
-
206
-
207
-
208
-
209
-
210
-
211
-
212
-
213
-
214
-
215
-
216
-
217
-
218
-
219
-
220
-
221
-
222
-
223
-
224
-
225
-
226
-
227
-
228
-
229
-
230
-
231
-
232
-
233
-
234
-
235
-
236
-
237
-
238
-
239
-
240
-
241
-
242
-
243
-
244
-
245
-
246
-
247
-
248
-
249
-
250
-
251
-
252
 |
 |

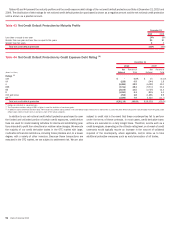
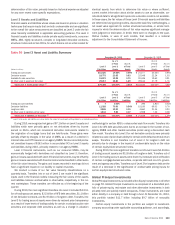
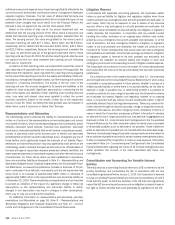
The graph below shows daily trading-related revenue and VaR for the twelve
months ended December 31, 2010. Actual losses did not exceed daily trading
VaR in the twelve months ended December 31, 2010 and 2009. Our VaR model
uses a historical simulation approach based on three years of historical data
and an expected shortfall methodology equivalent to a 99 percent confidence
level. Statistically, this means that losses will exceed VaR, on average, one out
of 100 trading days, or two to three times each year.
Trading Risk and Return
Daily Trading-related Revenue and VaR
300
-400
-300
-200
-100
0
100
200
400
(Dollars in millions)
Daily
Trading-
related
Revenue
VaR
12/31/2009 3/31/2010 6/30/2010 9/30/2010 12/31/2010
Table 52 presents average, high and low daily trading VaR for 2010 and 2009.
Table 52 Trading Activities Market Risk VaR
(Dollars in millions)
Average High
(1)
Low
(1)
Average High
(1)
Low
(1)
2010 2009
Foreign exchange
$ 23.8 $ 73.1 $ 4.9
$ 20.3 $ 55.4 $ 6.1
Interest rate
64.1 128.3 33.2
73.7 136.7 43.6
Credit
171.5 287.2 122.9
183.3 338.7 123.9
Real estate/mortgage
83.1 138.5 42.9
51.1 81.3 32.4
Equities
39.4 90.9 20.8
44.6 87.6 23.6
Commodities
19.9 31.7 12.8
20.2 29.1 16.0
Portfolio diversification
(200.5) – –
(187.0) – –
Total market-based trading portfolio
$ 201.3 $375.2 $123.0
$ 206.2 $325.2 $117.9
(1)
The high and low for the total portfolio may not equal the sum of the individual components as the highs or lows of the individual portfolios may have occurred on different trading days.
The decrease in average VaR during 2010 resulted from reduced expo-
sures in several businesses. In addition, portfolio diversification increased
relative to average VaR, as exposure changes resulted in reduced correlations
across businesses.
Counterparty credit risk is an adjustment to the mark-to-market value of
our derivative exposures reflecting the impact of the credit quality of counter-
parties on our derivative assets. Since counterparty credit exposure is not
included in the VaR component of the regulatory capital allocation, we do not
include it in our trading VaR, and it is therefore not included in the daily trading-
related revenue illustrated in our histogram or used for backtesting.
Trading Portfolio Stress Testing
Because the very nature of a VaR model suggests results can exceed our
estimates, we also “stress test” our portfolio. Stress testing estimates the
value change in our trading portfolio that may result from abnormal market
movements. Various scenarios, categorized as either historical or hypothet-
ical, are regularly run and reported for the overall trading portfolio and
individual businesses. Historical scenarios simulate the impact of price
changes that occurred during a set of extended historical market events.
Generally, a 10-business-day window or longer, representing the most severe
point during a crisis, is selected for each historical scenario. Hypothetical
scenarios provide simulations of anticipated shocks from predefined market
stress events. These stress events include shocks to underlying market risk
variables which may be well beyond the shocks found in the historical data
used to calculate VaR. As with the historical scenarios, the hypothetical
scenarios are designed to represent a short-term market disruption. Scenar-
ios are reviewed and updated as necessary in light of changing positions and
new economic or political information. In addition to the value afforded by the
results themselves, this information provides senior management with a clear
picture of the trend of risk being taken given the relatively static nature of the
shocks applied. Stress testing for the trading portfolio is also integrated with
enterprise-wide stress testing and incorporated into the limits framework. A
process has been established to promote consistency between the scenarios
used for the trading portfolio and those used for enterprise-wide stress
testing. The scenarios used for enterprise-wide stress testing purposes differ
from the typical trading portfolio scenarios in that they have a longer time
horizon and the results are forecasted over multiple periods for use in
consolidated capital and liquidity planning. For additional information on
enterprise-wide stress testing, see page 72.
106 Bank of America 2010