Bank of America 2010 Annual Report Download - page 121
Download and view the complete annual report
Please find page 121 of the 2010 Bank of America annual report below. You can navigate through the pages in the report by either clicking on the pages listed below, or by using the keyword search tool below to find specific information within the annual report.-
 1
1 -
2
-
3
-
4
-
5
-
6
-
7
-
8
-
9
-
10
-
11
-
12
-
13
-
14
-
15
-
16
-
17
-
18
-
19
-
20
-
21
-
22
-
23
-
24
-
25
-
26
-
27
-
28
-
29
-
30
-
31
-
32
-
33
-
34
-
35
-
36
-
37
-
38
-
39
-
40
-
41
-
42
-
43
-
44
-
45
-
46
-
47
-
48
-
49
-
50
-
51
-
52
-
53
-
54
-
55
-
56
-
57
-
58
-
59
-
60
-
61
-
62
-
63
-
64
-
65
-
66
-
67
-
68
-
69
-
70
-
71
-
72
-
73
-
74
-
75
-
76
-
77
-
78
-
79
-
80
-
81
-
82
-
83
-
84
-
85
-
86
-
87
-
88
-
89
-
90
-
91
-
92
-
93
-
94
-
95
-
96
-
97
-
98
-
99
-
100
-
101
-
102
-
103
-
104
-
105
-
106
-
107
-
108
-
109
-
110
-
 111
111 -
 112
112 -
 113
113 -
 114
114 -
 115
115 -
 116
116 -
 117
117 -
 118
118 -
 119
119 -
 120
120 -
 121
121 -
 122
122 -
 123
123 -
 124
124 -
 125
125 -
 126
126 -
 127
127 -
 128
128 -
 129
129 -
 130
130 -
 131
131 -
132
-
133
-
134
-
135
-
136
-
137
-
138
-
139
-
140
-
141
-
142
-
143
-
144
-
145
-
146
-
147
-
148
-
149
-
150
-
151
-
152
-
153
-
154
-
155
-
156
-
157
-
158
-
159
-
160
-
161
-
162
-
163
-
164
-
165
-
166
-
167
-
168
-
169
-
170
-
171
-
172
-
173
-
174
-
175
-
176
-
177
-
178
-
179
-
180
-
181
-
182
-
183
-
184
-
185
-
186
-
187
-
188
-
189
-
190
-
191
-
192
-
193
-
194
-
195
-
196
-
197
-
198
-
199
-
200
-
201
-
202
-
203
-
204
-
205
-
206
-
207
-
208
-
209
-
210
-
211
-
212
-
213
-
214
-
215
-
216
-
217
-
218
-
219
-
220
-
221
-
222
-
223
-
224
-
225
-
226
-
227
-
228
-
229
-
230
-
231
-
232
-
233
-
234
-
235
-
236
-
237
-
238
-
239
-
240
-
241
-
242
-
243
-
244
-
245
-
246
-
247
-
248
-
249
-
250
-
251
-
252
 |
 |

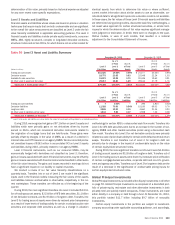
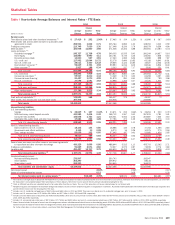
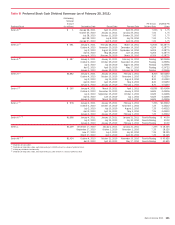
Statistical Tables
Table I Year-to-date Average Balances and Interest Rates – FTE Basis
(Dollars in millions)
Average
Balance
Interest
Income/
Expense
Yield/
Rate
Average
Balance
Interest
Income/
Expense
Yield/
Rate
Average
Balance
Interest
Income/
Expense
Yield/
Rate
2010
2009 2008
Earning assets
Time deposits placed and other short-term investments
(1)
$ 27,419 $ 292 1.06%
$ 27,465 $ 334 1.22% $ 10,696 $ 367 3.43%
Federal funds sold and securities borrowed or purchased under
agreements to resell
256,943 1,832 0.71
235,764 2,894 1.23 128,053 3,313 2.59
Trading account assets
213,745 7,050 3.30
217,048 8,236 3.79 186,579 9,259 4.96
Debt securities
(2)
323,946 11,850 3.66
271,048 13,224 4.88 250,551 13,383 5.34
Loans and leases
(3)
:
Residential mortgage
(4)
245,727 11,736 4.78
249,335 13,535 5.43 260,244 14,657 5.63
Home equity
145,860 5,990 4.11
154,761 6,736 4.35 135,060 7,606 5.63
Discontinued real estate
13,830 527 3.81
17,340 1,082 6.24 10,898 858 7.87
U.S. credit card
117,962 12,644 10.72
52,378 5,666 10.82 63,318 6,843 10.81
Non-U.S. credit card
28,011 3,450 12.32
19,655 2,122 10.80 16,527 2,042 12.36
Direct/Indirect consumer
(5)
96,649 4,753 4.92
99,993 6,016 6.02 82,516 6,934 8.40
Other consumer
(6)
2,927 186 6.34
3,303 237 7.17 3,816 321 8.41
Total consumer
650,966 39,286 6.04
596,765 35,394 5.93 572,379 39,261 6.86
U.S. commercial
195,895 7,909 4.04
223,813 8,883 3.97 220,554 11,702 5.31
Commercial real estate
(7)
59,947 2,000 3.34
73,349 2,372 3.23 63,208 3,057 4.84
Commercial lease financing
21,427 1,070 4.99
21,979 990 4.51 22,290 799 3.58
Non-U.S. commercial
30,096 1,091 3.62
32,899 1,406 4.27 32,440 1,503 4.63
Total commercial
307,365 12,070 3.93
352,040 13,651 3.88 338,492 17,061 5.04
Total loans and leases
958,331 51,356 5.36
948,805 49,045 5.17 910,871 56,322 6.18
Other earning assets
117,189 3,919 3.34
130,063 5,105 3.92 75,972 4,161 5.48
Total earning assets
(8)
1,897,573 76,299 4.02
1,830,193 78,838 4.31 1,562,722 86,805 5.55
Cash and cash equivalents
(1)
174,621 368
196,237 379 45,367 73
Other assets, less allowance for loan and lease losses
367,408
416,638 235,896
Total assets
$2,439,602
$2,443,068 $1,843,985
Interest-bearing liabilities
U.S. interest-bearing deposits:
Savings
$ 36,649 $ 157 0.43%
$ 33,671 $ 215 0.64% $ 32,204 $ 230 0.71%
NOW and money market deposit accounts
441,589 1,405 0.32
358,712 1,557 0.43 267,831 3,781 1.41
Consumer CDs and IRAs
142,648 1,723 1.21
218,041 5,054 2.32 203,887 7,404 3.63
Negotiable CDs, public funds and other time deposits
17,683 226 1.28
37,796 473 1.25 32,264 1,076 3.33
Total U.S. interest-bearing deposits
638,569 3,511 0.55
648,220 7,299 1.13 536,186 12,491 2.33
Non-U.S. interest-bearing deposits:
Banks located in non-U.S. countries
18,102 144 0.80
18,688 145 0.78 37,354 1,056 2.83
Governments and official institutions
3,349 10 0.28
6,270 16 0.26 10,975 279 2.54
Time, savings and other
55,059 332 0.60
57,045 347 0.61 53,695 1,424 2.65
Total non-U.S. interest-bearing deposits
76,510 486 0.64
82,003 508 0.62 102,024 2,759 2.70
Total interest-bearing deposits
715,079 3,997 0.56
730,223 7,807 1.07 638,210 15,250 2.39
Federal funds purchased, securities loaned or sold under agreements
to repurchase and other short-term borrowings
430,329 3,699 0.86
488,644 5,512 1.13 455,703 12,362 2.71
Trading account liabilities
91,669 2,571 2.80
72,207 2,075 2.87 72,915 2,774 3.80
Long-term debt
490,497 13,707 2.79
446,634 15,413 3.45 231,235 9,938 4.30
Total interest-bearing liabilities
(8)
1,727,574 23,974 1.39
1,737,708 30,807 1.77 1,398,063 40,324 2.88
Noninterest-bearing sources:
Noninterest-bearing deposits
273,507
250,743 192,947
Other liabilities
205,290
209,972 88,144
Shareholders’ equity
233,231
244,645 164,831
Total liabilities and shareholders’ equity
$2,439,602
$2,443,068 $1,843,985
Net interest spread
2.63%
2.54% 2.67%
Impact of noninterest-bearing sources
0.13
0.08 0.30
Net interest income/yield on earning assets
(1)
$52,325 2.76%
$48,031 2.62% $46,481 2.97%
(1)
Fees earned on overnight deposits placed with the Federal Reserve, which were included in time deposits placed and other short-term investments in prior periods, have been reclassified to cash and cash equivalents, consistent with
the Corporation’s Consolidated Balance Sheet presentation of these deposits. Net interest income and net interest yield are calculated excluding these fees.
(2)
Yields on AFS debt securities are calculated based on fair value rather than the cost basis. The use of fair value does not have a material impact on net interest yield.
(3)
Nonperforming loans are included in the respective average loan balances. Income on these nonperforming loans is recognized on a cash basis. Purchased credit-impaired loans were written down to fair value upon acquisition and
accrete interest income over the remaining life of the loan.
(4)
Includes non-U.S. residential mortgage loans of $410 million and $622 million in 2010 and 2009. There were no material non-U.S. residential mortgage loans prior to January 1, 2009.
(5)
Includes non-U.S. consumer loans of $7.9 billion, $8.0 billion and $2.7 billion in 2010, 2009 and 2008, respectively.
(6)
Includes consumer finance loans of $2.1 billion, $2.4 billion and $2.8 billion; other non-U.S. consumer loans of $731 million, $657 million and $774 million;and consumer overdrafts of $111 million, $217 million and $247 million in
2010, 2009 and 2008, respectively.
(7)
Includes U.S. commercial real estate loans of $57.3 billion, $70.7 billion and $62.1 billion; and non-U.S. commercial real estate loans of $2.7 billion, $2.7 billion and $1.1 billion in 2010, 2009 and 2008, respectively.
(8)
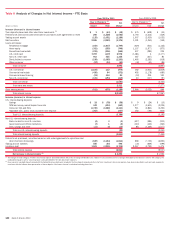
Interest income includes the impact of interest rate risk management contracts, which decreased interest income on the underlying assets $1.4 billion, $456 million and $260 million in 2010, 2009 and 2008, respectively. Interest
expense includes the impact of interest rate risk management contracts, which increased (decreased) interest expense on the underlying liabilities $(3.5) billion, $(3.0) billion and $409 million in 2010, 2009 and 2008, respectively.
For further information on interest rate contracts, see Interest Rate Risk Management for Nontrading Activities beginning on page 107.
Bank of America 2010 119