Bank of America 2010 Annual Report Download - page 36
Download and view the complete annual report
Please find page 36 of the 2010 Bank of America annual report below. You can navigate through the pages in the report by either clicking on the pages listed below, or by using the keyword search tool below to find specific information within the annual report.-
 1
1 -
2
-
3
-
4
-
5
-
6
-
7
-
8
-
9
-
10
-
11
-
12
-
13
-
14
-
15
-
16
-
17
-
18
-
19
-
20
-
21
-
22
-
23
-
24
-
25
-
 26
26 -
 27
27 -
 28
28 -
 29
29 -
 30
30 -
 31
31 -
 32
32 -
 33
33 -
 34
34 -
 35
35 -
 36
36 -
 37
37 -
 38
38 -
 39
39 -
 40
40 -
 41
41 -
 42
42 -
 43
43 -
 44
44 -
 45
45 -
 46
46 -
47
-
48
-
49
-
50
-
51
-
52
-
53
-
54
-
55
-
56
-
57
-
58
-
59
-
60
-
61
-
62
-
63
-
64
-
65
-
66
-
67
-
68
-
69
-
70
-
71
-
72
-
73
-
74
-
75
-
76
-
77
-
78
-
79
-
80
-
81
-
82
-
83
-
84
-
85
-
86
-
87
-
88
-
89
-
90
-
91
-
92
-
93
-
94
-
95
-
96
-
97
-
98
-
99
-
100
-
101
-
102
-
103
-
104
-
105
-
106
-
107
-
108
-
109
-
110
-
111
-
112
-
113
-
114
-
115
-
116
-
117
-
118
-
119
-
120
-
121
-
122
-
123
-
124
-
125
-
126
-
127
-
128
-
129
-
130
-
131
-
132
-
133
-
134
-
135
-
136
-
137
-
138
-
139
-
140
-
141
-
142
-
143
-
144
-
145
-
146
-
147
-
148
-
149
-
150
-
151
-
152
-
153
-
154
-
155
-
156
-
157
-
158
-
159
-
160
-
161
-
162
-
163
-
164
-
165
-
166
-
167
-
168
-
169
-
170
-
171
-
172
-
173
-
174
-
175
-
176
-
177
-
178
-
179
-
180
-
181
-
182
-
183
-
184
-
185
-
186
-
187
-
188
-
189
-
190
-
191
-
192
-
193
-
194
-
195
-
196
-
197
-
198
-
199
-
200
-
201
-
202
-
203
-
204
-
205
-
206
-
207
-
208
-
209
-
210
-
211
-
212
-
213
-
214
-
215
-
216
-
217
-
218
-
219
-
220
-
221
-
222
-
223
-
224
-
225
-
226
-
227
-
228
-
229
-
230
-
231
-
232
-
233
-
234
-
235
-
236
-
237
-
238
-
239
-
240
-
241
-
242
-
243
-
244
-
245
-
246
-
247
-
248
-
249
-
250
-
251
-
252
 |
 |
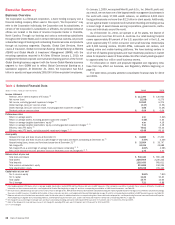
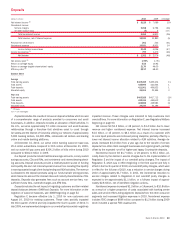
Assets
Federal Funds Sold and Securities Borrowed or Purchased
Under Agreements to Resell
Federal funds transactions involve lending reserve balances on a short-term
basis. Securities borrowed and securities purchased under agreements to
resell are utilized to accommodate customer transactions, earn interest rate
spreads and obtain securities for settlement. Year-end federal funds sold and
securities borrowed or purchased under agreements to resell increased
$19.7 billion and average amounts increased $21.2 billion in 2010 compared
to 2009, attributable primarily to a favorable rate environment and increased
customer activity.
Trading Account Assets
Trading account assets consist primarily of fixed-income securities (including
government and corporate debt), and equity and convertible instruments.
Year-end trading account assets increased $12.5 billion in 2010 compared to
2009 primarily due to the adoption of new consolidation guidance as well as
the consolidation of a VIE late in 2010. Average trading account assets
decreased slightly in 2010 as compared to 2009.
Debt Securities
Debt securities include U.S. Treasury and agency securities, mortgage-
backed securities (MBS), principally agency MBS, foreign bonds, corporate
bonds and municipal debt. We use the debt securities portfolio primarily to
manage interest rate and liquidity risk and to take advantage of market
conditions that create more economically attractive returns on these invest-
ments. Year-end and average balances of debt securities increased $26.6 bil-
lion and $52.9 billion in 2010 compared to 2009 due to agency MBS
purchases. For additional information on AFS debt securities, see Market
Risk Management – Securities beginning on page 107 and Note 5 – Securi-
ties to the Consolidated Financial Statements.
Loans and Leases
Year-end and average loans and leases increased $40.3 billion to $940.4 bil-
lion and $9.5 billion to $958.3 billion in 2010 compared to 2009. The
increase was primarily due to the impact of adopting new consolidation
guidance partially offset by continued deleveraging by consumers, tighter
underwriting and the elevated levels of liquidity of commercial clients. For a
more detailed discussion of the loan portfolio, see Credit Risk Management
beginning on page 75 and Note 6 – Outstanding Loans and Leases to the
Consolidated Financial Statements.
Allowance for Loan and Lease Losses
Year-end and average allowance for loan lease losses increased $4.7 billion
and $12.3 billion in 2010 compared to 2009 primarily due to the $10.8 billion
of reserves recorded on January 1, 2010 in connection with the adoption of
new consolidation guidance and reserve additions in the PCI portfolio through-
out 2010. These were partially offset by reserve reductions during 2010 due
to the impacts of the improving economy. For a more detailed discussion of
the Allowance for Loan and Lease Losses, see Allowance for Loan and Lease
Losses beginning on page 101.
All Other Assets
Year-end and average other assets decreased $59.7 billion and $71.5 billion
in 2010 compared to 2009 driven primarily by the sale of strategic invest-
ments and goodwill impairment charges.
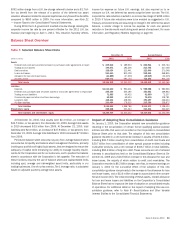
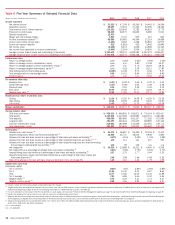
Liabilities
Deposits
Year-end and average deposits increased $18.8 billion to $1.0 trillion and
$7.6 billion to $988.6 billion in 2010 compared to 2009. The increase was
attributable to growth in our noninterest-bearing deposits, NOW and money
market accounts primarily driven by affluent, and commercial and corporate
clients, partially offset by a decrease in time deposits as a result of customer
shift to more liquid products.
Federal Funds Purchased and Securities Loaned or Sold Un-
der Agreements to Repurchase
Federal funds transactions involve borrowing reserve balances on a short-
term basis. Securities loaned and securities sold under agreements to
repurchase are collateralized borrowing transactions utilized to accommodate
customer transactions, earn interest rate spreads and finance assets on the
balance sheet. Year-end and average federal funds purchased and securities
loaned or sold under agreements to repurchase decreased $9.8 billion and
$16.2 billion in 2010 compared to 2009 primarily due to lower funding
requirements.
Trading Account Liabilities
Trading account liabilities consist primarily of short positions in fixed-income
securities (including government and corporate debt), equity and convertible
instruments. Year-end and average trading account liabilities increased
$6.5 billion and $19.5 billion in 2010 compared to 2009 due to trading
activity in fixed-income securities.
Commercial Paper and Other Short-term Borrowings
Commercial paper and other short-term borrowings provide a funding source
to supplement deposits in our ALM strategy. Year-end and average commer-
cial paper and other short-term borrowings decreased $9.6 billion to $60.0 bil-
lion and decreased $42.1 billion to $76.7 billion in 2010 compared to 2009
as a result of our strengthened liquidity position.
Long-term Debt
Year-end and average long-term debt increased by $9.9 billion to $448.4 bil-
lion and $43.9 billion to $490.5 billion in 2010 compared to 2009. The
increases were attributable to the $84.4 billion impact of new consolidation
guidance as discussed on page 33 offset by maturities outpacing new
issuances and the Corporation’s strategy to reduce our long-term debt. For
additional information on long-term debt, see Note 13 – Long-term Debt to the
Consolidated Financial Statements.
All Other Liabilities
Year-end all other liabilities increased $22.0 billion in 2010 compared to
2009 driven primarily by adoption of new consolidation guidance.
Shareholders’ Equity
Year-end and average shareholders’ equity decreased $3.2 billion and
$11.4 billion in 2010 compared to 2009. The decrease was driven primarily
by the goodwill impairment charges of $12.4 billion and the impact of adopting
new consolidation guidance as we recorded a $6.2 billion charge to retained
earnings for newly consolidated loans partially offset by changes in accumu-
lated OCI.
34 Bank of America 2010