Bank of America 2010 Annual Report Download - page 101
Download and view the complete annual report
Please find page 101 of the 2010 Bank of America annual report below. You can navigate through the pages in the report by either clicking on the pages listed below, or by using the keyword search tool below to find specific information within the annual report.-
 1
1 -
2
-
3
-
4
-
5
-
6
-
7
-
8
-
9
-
10
-
11
-
12
-
13
-
14
-
15
-
16
-
17
-
18
-
19
-
20
-
21
-
22
-
23
-
24
-
25
-
26
-
27
-
28
-
29
-
30
-
31
-
32
-
33
-
34
-
35
-
36
-
37
-
38
-
39
-
40
-
41
-
42
-
43
-
44
-
45
-
46
-
47
-
48
-
49
-
50
-
51
-
52
-
53
-
54
-
55
-
56
-
57
-
58
-
59
-
60
-
61
-
62
-
63
-
64
-
65
-
66
-
67
-
68
-
69
-
70
-
71
-
72
-
73
-
74
-
75
-
76
-
77
-
78
-
79
-
80
-
81
-
82
-
83
-
84
-
85
-
86
-
87
-
88
-
89
-
90
-
 91
91 -
 92
92 -
 93
93 -
 94
94 -
 95
95 -
 96
96 -
 97
97 -
 98
98 -
 99
99 -
 100
100 -
 101
101 -
 102
102 -
 103
103 -
 104
104 -
 105
105 -
 106
106 -
 107
107 -
 108
108 -
 109
109 -
 110
110 -
 111
111 -
112
-
113
-
114
-
115
-
116
-
117
-
118
-
119
-
120
-
121
-
122
-
123
-
124
-
125
-
126
-
127
-
128
-
129
-
130
-
131
-
132
-
133
-
134
-
135
-
136
-
137
-
138
-
139
-
140
-
141
-
142
-
143
-
144
-
145
-
146
-
147
-
148
-
149
-
150
-
151
-
152
-
153
-
154
-
155
-
156
-
157
-
158
-
159
-
160
-
161
-
162
-
163
-
164
-
165
-
166
-
167
-
168
-
169
-
170
-
171
-
172
-
173
-
174
-
175
-
176
-
177
-
178
-
179
-
180
-
181
-
182
-
183
-
184
-
185
-
186
-
187
-
188
-
189
-
190
-
191
-
192
-
193
-
194
-
195
-
196
-
197
-
198
-
199
-
200
-
201
-
202
-
203
-
204
-
205
-
206
-
207
-
208
-
209
-
210
-
211
-
212
-
213
-
214
-
215
-
216
-
217
-
218
-
219
-
220
-
221
-
222
-
223
-
224
-
225
-
226
-
227
-
228
-
229
-
230
-
231
-
232
-
233
-
234
-
235
-
236
-
237
-
238
-
239
-
240
-
241
-
242
-
243
-
244
-
245
-
246
-
247
-
248
-
249
-
250
-
251
-
252
 |
 |

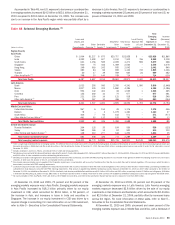
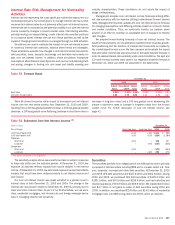
As presented in Table 48, non-U.S. exposure to borrowers or counterparties
in emerging markets increased $14.5 billion to $65.1 billion at December 31,
2010 compared to $50.6 billion at December 31, 2009. The increase was
due to an increase in the Asia Pacific region which was partially offset by a
decrease in Latin America. Non-U.S. exposure to borrowers or counterparties in
emerging markets represented 25 percent and 20 percent of total non-U.S. ex-
posure at December 31, 2010 and 2009.
Table 48 Selected Emerging Markets
(1)
(Dollars in millions)
Loans and
Leases, and
Loan
Commitments
Other
Financing
(2)
Derivative
Assets
(3)
Securities/
Other
Investments
(4)
Total Cross-
border
Exposure
(5)
Local Country
Exposure Net
of Local
Liabilities
(6)
Total
Emerging
Market
Exposure at
December 31,
2010
Increase
(Decrease)
From
December 31,
2009
Region/Country
Asia Pacific
China $ 1,064 $1,237 $ 870 $20,757 $23,928 $ –
$23,928
$11,865
India 3,292 1,590 607 2,013 7,502 766
8,268
2,108
South Korea 621 1,156 585 2,009 4,371 908
5,279
268
Singapore 560 75 442 1,469 2,546 –
2,546
1,678
Hong Kong 349 516 242 935 2,042 –
2,042
940
Taiwan 283 64 84 692 1,123 732
1,855
1,126
Thailand 20 17 39 569 645 24
669
482
Other Asia Pacific
(7)
298 32 145 239 714 –
714
(130)
Total Asia Pacific
6,487 4,687 3,014 28,683 42,871 2,430
45,301
18,337
Latin America
Brazil 1,033 293 560 2,355 4,241 1,565
5,806
(3,648)
Mexico 1,917 305 303 1,860 4,385 –
4,385
(1,086)
Chile 954 132 401 38 1,525 1
1,526
365
Colombia 132 460 10 75 677 –
677
481
Peru 231 150 16 121 518 –
518
248
Other Latin America
(7)
74 167 10 456 707 153
860
(154)
Total Latin America
4,341 1,507 1,300 4,905 12,053 1,719
13,772
(3,794)
Middle East and Africa
United Arab Emirates 967 6 154 49 1,176 –
1,176
456
Bahrain 78 – 3 1,079 1,160 –
1,160
27
South Africa 406 7 56 102 571 –
571
(577)
Other Middle East and Africa
(7)
441 55 132 153 781 –
781
13
Total Middle East and Africa
1,892 68 345 1,383 3,688 –
3,688
(81)
Central and Eastern Europe
Russian Federation 264 133 35 104 536 –
536
(133)
Turkey 269 165 14 52 500 –
500
112
Other Central and Eastern Europe
(7)
148 210 277 618 1,253 –
1,253
35
Total Central and Eastern Europe
681 508 326 774 2,289 –
2,289
14
Total emerging market exposure
$13,401 $6,770 $4,985 $35,745 $60,901 $4,149
$65,050
$14,476
(1)
There is no generally accepted definition of emerging markets. The definition that we use includes all countries in Asia Pacific excluding Japan, Australia and New Zealand; all countries in Latin America excluding Cayman Islands and
Bermuda; all countries in Middle East and Africa; and all countries in Central and Eastern Europe. At December 31, 2010, there was $460 million in emerging market exposure accounted for under the fair value option, none at
December 31, 2009.
(2)
Includes acceptances, due froms, SBLCs, commercial letters of credit and formal guarantees.
(3)
Derivative assets are carried at fair value and have been reduced by the amount of cash collateral applied of $1.2 billion and $557 million at December 31, 2010 and 2009. At December 31, 2010 and 2009, there were $408 million
and $616 million of other marketable securities collateralizing derivative assets.
(4)
Generally, cross-border resale agreements are presented based on the domicile of the counterparty, consistent with FFIEC reporting requirements. Cross-border resale agreements where the underlying securities are U.S. Treasury
securities, in which case the domicile is the U.S., are excluded from this presentation.
(5)
Cross-border exposure includes amounts payable to the Corporation by borrowers or counterparties with a country of residence other than the one in which the credit is booked, regardless of the currency in which the claim is
denominated, consistent with FFIEC reporting requirements.
(6)
Local country exposure includes amounts payable to the Corporation by borrowers with a country of residence in which the credit is booked regardless of the currency in which the claim is denominated. Local funding or liabilities are
subtracted from local exposures consistent with FFIEC reporting requirements. Total amount of available local liabilities funding local country exposure at December 31, 2010 was $15.7 billion compared to $17.6 billion at
December 31, 2009. Local liabilities at December 31, 2010 in Asia Pacific, Latin America, and Middle East and Africa were $15.1 billion, $451 million and $193 million, respectively, of which $7.9 billion was in Singapore, $1.8 billion
in both China and Hong Kong, $1.2 billion in India, $802 million in South Korea and $573 million in Taiwan. There were no other countries with available local liabilities funding local country exposure greater than $500 million.
(7)
No country included in Other Asia Pacific, Other Latin America, Other Middle East and Africa, and Other Central and Eastern Europe had total non-U.S. exposure of more than $500 million.
At December 31, 2010 and 2009, 70 percent and 53 percent of the
emerging markets exposure was in Asia Pacific. Emerging markets exposure
in Asia Pacific increased by $18.3 billion primarily driven by our equity
investment in CCB, which accounted for $10.6 billion, or 58 percent, of
the increase in Asia, and increases in loans in India and securities in
Singapore. The increase in our equity investment in CCB was driven by a
required change in accounting. For more information on our CCB investment,
refer to Note 5 – Securities to the Consolidated Financial Statements.
At December 31, 2010 and 2009, 21 percent and 35 percent of the
emerging markets exposure was in Latin America. Latin America emerging
markets exposure decreased $3.8 billion driven by the sale of our equity
investments in Itaú Unibanco and Santander, which accounted for $5.4 billion
and $2.5 billion at December 31, 2009, partially offset by increased loans
across the region. For more information on these sales, refer to Note 5 –
Securities to the Consolidated Financial Statements.
At December 31, 2010 and 2009, six percent and seven percent of the
emerging markets exposure was in Middle East and Africa, with a decrease of
Bank of America 2010 99