Bank of America 2010 Annual Report Download - page 31
Download and view the complete annual report
Please find page 31 of the 2010 Bank of America annual report below. You can navigate through the pages in the report by either clicking on the pages listed below, or by using the keyword search tool below to find specific information within the annual report.-
 1
1 -
2
-
3
-
4
-
5
-
6
-
7
-
8
-
9
-
10
-
11
-
12
-
13
-
14
-
15
-
16
-
17
-
18
-
19
-
20
-
 21
21 -
 22
22 -
 23
23 -
 24
24 -
 25
25 -
 26
26 -
 27
27 -
 28
28 -
 29
29 -
 30
30 -
 31
31 -
 32
32 -
 33
33 -
 34
34 -
 35
35 -
 36
36 -
 37
37 -
 38
38 -
 39
39 -
 40
40 -
 41
41 -
42
-
43
-
44
-
45
-
46
-
47
-
48
-
49
-
50
-
51
-
52
-
53
-
54
-
55
-
56
-
57
-
58
-
59
-
60
-
61
-
62
-
63
-
64
-
65
-
66
-
67
-
68
-
69
-
70
-
71
-
72
-
73
-
74
-
75
-
76
-
77
-
78
-
79
-
80
-
81
-
82
-
83
-
84
-
85
-
86
-
87
-
88
-
89
-
90
-
91
-
92
-
93
-
94
-
95
-
96
-
97
-
98
-
99
-
100
-
101
-
102
-
103
-
104
-
105
-
106
-
107
-
108
-
109
-
110
-
111
-
112
-
113
-
114
-
115
-
116
-
117
-
118
-
119
-
120
-
121
-
122
-
123
-
124
-
125
-
126
-
127
-
128
-
129
-
130
-
131
-
132
-
133
-
134
-
135
-
136
-
137
-
138
-
139
-
140
-
141
-
142
-
143
-
144
-
145
-
146
-
147
-
148
-
149
-
150
-
151
-
152
-
153
-
154
-
155
-
156
-
157
-
158
-
159
-
160
-
161
-
162
-
163
-
164
-
165
-
166
-
167
-
168
-
169
-
170
-
171
-
172
-
173
-
174
-
175
-
176
-
177
-
178
-
179
-
180
-
181
-
182
-
183
-
184
-
185
-
186
-
187
-
188
-
189
-
190
-
191
-
192
-
193
-
194
-
195
-
196
-
197
-
198
-
199
-
200
-
201
-
202
-
203
-
204
-
205
-
206
-
207
-
208
-
209
-
210
-
211
-
212
-
213
-
214
-
215
-
216
-
217
-
218
-
219
-
220
-
221
-
222
-
223
-
224
-
225
-
226
-
227
-
228
-
229
-
230
-
231
-
232
-
233
-
234
-
235
-
236
-
237
-
238
-
239
-
240
-
241
-
242
-
243
-
244
-
245
-
246
-
247
-
248
-
249
-
250
-
251
-
252
 |
 |
2010 Economic and Business Environment
The banking environment and markets in which we conduct our businesses
will continue to be strongly influenced by developments in the U.S. and global
economies, as well as the continued implementation and rulemaking from
recent financial reforms. The global economy continued to recover in 2010,
but growth was very uneven across countries and regions. Emerging nations,
led by China, India and Brazil, expanded rapidly, while the U.S., U.K., Europe
and Japan continued to grow modestly.
United States
In the U.S., the economy began to recover early in 2010, fueled by moderate
growth in consumption and inventory rebuilding, but slowed in late spring,
coincident with the intensification of Europe’s financial crisis. A slowdown in
consumption and domestic demand growth contributed to weak employment
gains and an unemployment rate that drifted close to 10 percent.
Year-over-year inflation measures receded below one percent and stock
market indices declined. Concerns about high unemployment and fears that
the U.S. might incur deflation led the Federal Reserve to adopt a second round
of quantitative easing that involved purchases of $600 billion of U.S. Treasury
securities scheduled to occur through June 2011. The announcement of this
policy led to lower interest rates. Bond yields rebounded in the second half of
2010 as the U.S. economy reaccelerated, driven by stronger consumer
spending, rapid growth of exports and business investment in equipment
and software. The strong holiday retail season provided healthy economic
momentum toward year end. Despite only moderate economic growth in
2010, corporate profits rose sharply, benefiting from strong productivity gains
and constraints on hiring and operating costs. Cautious business financial
practices resulted in a record-breaking $1.5 trillion in free cash flows at non-
financial businesses.
The housing market remained weak throughout 2010. Home sales were
soft, despite lower home prices and low interest rates. There were delays in
the foreclosure process on the large number of distressed mortgages and the
supply of unsold homes remained high. Based on available Home Price Index
(HPI) information, the mild improvement in home prices that occurred in the
second half of 2009 continued into early 2010. However, housing prices
renewed a downward trend in the second half of 2010, due in part to the
expiration of tax incentives for home buyers.
Credit quality of bank loans to businesses and households improved
significantly in 2010 and the continued economic recovery improved the
environment for bank lending. Bank commercial and industrial loans to busi-
nesses increased in the last few months of 2010, following their steep
recession-related declines, reflecting increasing loan demand relating to
stronger production, inventory building and capital spending. Rising dispos-
able personal income, household deleveraging and improving household
finances contributed to improving consumer credit quality.
Europe
In Europe, a financial crisis emerged in mid-2010, triggered by high budget
deficits and rising direct and contingent sovereign debt in Greece, Ireland,
Italy, Portugal and Spain that created concerns about the ability of these
European Union (EU) “peripheral nations” to continue to service their debt
obligations. These conditions impacted financial markets and resulted in high
and volatile bond yields on the sovereign debt of many EU nations. The
financial crisis and efforts by the European Commission, European Central
Bank (ECB) and International Monetary Fund (IMF) to negotiate a financial
suppor t package to financially challenged EU nations unsettled global finan-
cial markets and contributed to Euro exchange rate and interest rate volatility.
Economic performance of certain EU “core nations,” led by Germany, re-
mained healthy throughout 2010, while the economies of Greece, Ireland,
Italy, Portugal and Spain experienced recessionary conditions and slowing
growth in response to the financial crisis and the implementation of fiscal
austerity programs. Additionally, Spain and Ireland’s economies declined as a
result of material deterioration in their housing sectors. Uncertainty over the
outcome of the EU governments’ financial support programs and worries
about sovereign finances continued through year end. For information on our
exposure in Europe, see Non-U.S. Portfolio beginning on page 98 and
Note 28 – Performance by Geographical Area to the Consolidated Financial
Statements.
Asia
Asia, excluding Japan, continued to outperform all other regions in 2010 with
strong growth across most countries. China and India continued to lead the
region in terms of growth and China became the second largest economy in
the world after the U.S., eclipsing Japan. Growth across the region became
broader based with consumer demand, investment activity and exports all
performing well. Asia remained well positioned to withstand global shocks
because of record international reserves, current account surpluses and
reduced external leverage. Many Asian nations, including China, Taiwan,
South Korea, Thailand and Malaysia, are net external creditors, with China
and Japan among the largest holders of U.S. Treasury bonds. Bank balance
sheets have improved across most of the region and asset quality issues have
remained manageable. Among the key challenges faced by the region were
large capital inflows that placed appreciation pressures on most currencies
against the U.S. Dollar (USD), complicating monetary policy and adding to
excess liquidity pressures. Most countries in the region, including China,
India, South Korea, Thailand and Indonesia, began to withdraw fiscal stimulus
and tighten monetary policy with hikes in interest rates as growth gathered
momentum and as food and broader price inflation pressures began to
increase. Japan performed well early in the year, but the economy weakened
at the end of the year due to weakening consumer demand, and appreciation
of the yen that hurt export competitiveness. For information on our exposure
in Asia, see Non-U.S. Portfolio beginning on page 98 and Note 28 – Perfor-
mance by Geographical Area to the Consolidated Financial Statements.
Emerging Nations
In the emerging nations, inflation pressures began to mount and their central
banks raised interest rates or took steps to tighten monetary policy and slow
bank lending. Strong growth in emerging nations and their favorable economic
outlooks attracted capital from the industrialized nations. The excess global
liquidity generated by the accommodative monetary policies of the Federal
Reserve, Bank of Japan and other central banks also flowed into emerging
nations. These capital inflows put upward pressure on many emerging nation
currencies. As a result, some emerging nations, such as Brazil, experienced
strong currency appreciation. However, in other nations, that peg their cur-
rencies to the U.S. dollar, currency appreciation was muted causing inflation-
ary pressures and rapid real estate price appreciation. Global economic
momentum, along with the generally weak U.S. dollar and easing monetary
policies in several industrialized nations, contributed to rising prices for
industrial commodities in these emerging nations. Through year end, inflation
pressures in key emerging nations continued to mount. For more information
on our emerging nations exposure, see Table 48 on page 99.
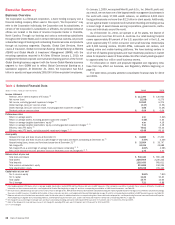
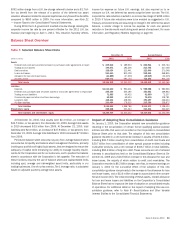
Performance Overview
In 2010, we reported a net loss of $2.2 billion compared to net income of
$6.3 billion in 2009. After preferred stock dividends and accretion of $1.4 bil-
lion in 2010 compared with $8.5 billion in 2009, net loss applicable to common
shareholders was $3.6 billion, or $0.37 per diluted common share, compared
to $2.2 billion, or $0.29 per diluted common share in 2009. Our 2010 results
reflected, among other things, $12.4 billion in goodwill impairment charges,
including non-cash, non-tax deductible goodwill impairment charges of
Bank of America 2010 29