Bank of America 2010 Annual Report Download - page 93
Download and view the complete annual report
Please find page 93 of the 2010 Bank of America annual report below. You can navigate through the pages in the report by either clicking on the pages listed below, or by using the keyword search tool below to find specific information within the annual report.-
 1
1 -
2
-
3
-
4
-
5
-
6
-
7
-
8
-
9
-
10
-
11
-
12
-
13
-
14
-
15
-
16
-
17
-
18
-
19
-
20
-
21
-
22
-
23
-
24
-
25
-
26
-
27
-
28
-
29
-
30
-
31
-
32
-
33
-
34
-
35
-
36
-
37
-
38
-
39
-
40
-
41
-
42
-
43
-
44
-
45
-
46
-
47
-
48
-
49
-
50
-
51
-
52
-
53
-
54
-
55
-
56
-
57
-
58
-
59
-
60
-
61
-
62
-
63
-
64
-
65
-
66
-
67
-
68
-
69
-
70
-
71
-
72
-
73
-
74
-
75
-
76
-
77
-
78
-
79
-
80
-
81
-
82
-
 83
83 -
 84
84 -
 85
85 -
 86
86 -
 87
87 -
 88
88 -
 89
89 -
 90
90 -
 91
91 -
 92
92 -
 93
93 -
 94
94 -
 95
95 -
 96
96 -
 97
97 -
 98
98 -
 99
99 -
 100
100 -
 101
101 -
 102
102 -
 103
103 -
104
-
105
-
106
-
107
-
108
-
109
-
110
-
111
-
112
-
113
-
114
-
115
-
116
-
117
-
118
-
119
-
120
-
121
-
122
-
123
-
124
-
125
-
126
-
127
-
128
-
129
-
130
-
131
-
132
-
133
-
134
-
135
-
136
-
137
-
138
-
139
-
140
-
141
-
142
-
143
-
144
-
145
-
146
-
147
-
148
-
149
-
150
-
151
-
152
-
153
-
154
-
155
-
156
-
157
-
158
-
159
-
160
-
161
-
162
-
163
-
164
-
165
-
166
-
167
-
168
-
169
-
170
-
171
-
172
-
173
-
174
-
175
-
176
-
177
-
178
-
179
-
180
-
181
-
182
-
183
-
184
-
185
-
186
-
187
-
188
-
189
-
190
-
191
-
192
-
193
-
194
-
195
-
196
-
197
-
198
-
199
-
200
-
201
-
202
-
203
-
204
-
205
-
206
-
207
-
208
-
209
-
210
-
211
-
212
-
213
-
214
-
215
-
216
-
217
-
218
-
219
-
220
-
221
-
222
-
223
-
224
-
225
-
226
-
227
-
228
-
229
-
230
-
231
-
232
-
233
-
234
-
235
-
236
-
237
-
238
-
239
-
240
-
241
-
242
-
243
-
244
-
245
-
246
-
247
-
248
-
249
-
250
-
251
-
252
 |
 |

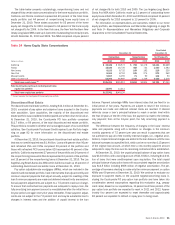
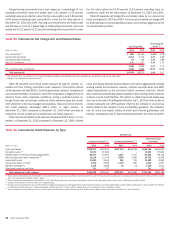
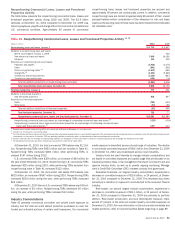
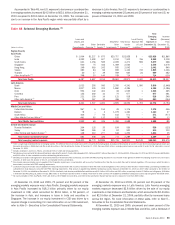
The tables below present commercial real estate credit quality data by non-homebuilder and homebuilder property types. The homebuilder portfolio includes
condominiums and other residential real estate.
Table 39 Commercial Real Estate Credit Quality Data
(Dollars in millions)
2010 2009 2010 2009
Nonperforming
Loans and
Foreclosed
Properties
(1)
Utilized Reservable
Criticized Exposure
(2)
December 31
Commercial real estate – non-homebuilder
Office
$1,061
$729
$3,956
$3,822
Multi-family rental
500
546
2,940
2,496
Shopping centers/retail
1,000
1,157
2,837
3,469
Industrial/warehouse
420
442
1,878
1,757
Multi-use
483
416
1,316
1,578
Hotels/motels
139
160
1,191
1,140
Land and land development
820
968
1,420
1,657
Other
(3)
168
417
1,604
2,210
Total non-homebuilder
4,591
4,835
17,142
18,129
Commercial real estate – homebuilder
1,963
3,228
3,376
5,675
Total commercial real estate
$6,554
$8,063
$20,518
$23,804
(1)
Includes commercial foreclosed properties of $725 million and $777 million at December 31, 2010 and 2009.
(2)
Utilized reservable criticized exposure corresponds to the Special Mention, Substandard and Doubtful asset categories defined by regulatory authorities. This includes loans, excluding those accounted for under the fair value option,
SBLCs and bankers’ acceptances.
(3)
Represents loans to borrowers whose primary business is commercial real estate, but the exposure is not secured by the listed property types or is unsecured.
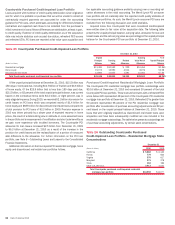
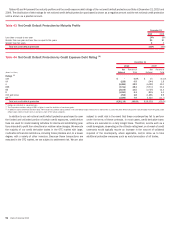
Table 40 Commercial Real Estate Net Charge-offs and Related Ratios
(Dollars in millions)
2010 2009 2010 2009
Net Charge-offs
Net Charge-off
Ratios
(1)
Commercial real estate – non-homebuilder
Office
$273
$249
2.49%
2.01%
Multi-family rental
116
217
1.21
1.96
Shopping centers/retail
318
239
3.56
2.30
Industrial/warehouse
59
82
1.07
1.34
Multi-use
143
146
2.92
2.58
Hotels/motels
45
5
1.02
0.08
Land and land development
377
286
13.04
8.00
Other
(2)
220
140
3.14
1.72
Total non-homebuilder
1,551
1,364
2.86
2.13
Commercial real estate – homebuilder
466
1,338
8.26
14.41
Total commercial real estate
$2,017
$2,702
3.37
3.69
(1)
Net charge-off ratios are calculated as net charge-offs divided by average outstanding loans excluding loans accounted for under the fair value option.
(2)
Represents loans to borrowers whose primary business is commercial real estate, but the exposure is not secured by the listed property types or is unsecured.
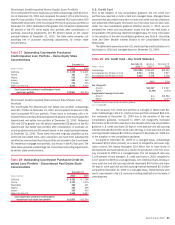
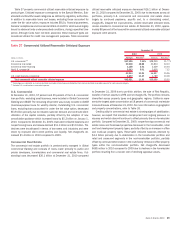
At December 31, 2010, we had total committed non-homebuilder expo-
sure of $64.2 billion compared to $84.4 billion at December 31, 2009, with
the decrease due to the sale of First Republic, repayments and net charge-
offs. Non-homebuilder nonperforming loans and foreclosed properties were
$4.6 billion, or 10.08 percent of total non-homebuilder loans and foreclosed
properties at December 31, 2010 compared to $4.8 billion, or 7.73 percent,
at December 31, 2009. Non-homebuilder utilized reservable criticized expo-
sure decreased to $17.1 billion, or 35.55 percent, at December 31, 2010
compared to $18.1 billion, or 27.27 percent, at December 31, 2009. The
decrease in criticized exposure was primarily in the retail and unsecured
segments, with the ratio increasing due to declining loan balances. For the
non-homebuilder portfolio, net charge-offs increased $187 million for 2010
compared to 2009. The changes were concentrated in land development and
retail.
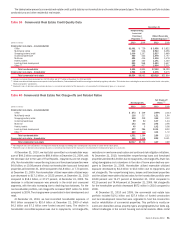
At December 31, 2010, we had committed homebuilder exposure of
$6.0 billion compared to $10.4 billion at December 31, 2009 of which
$4.3 billion and $7.3 billion were funded secured loans. The decline in
homebuilder committed exposure was due to repayments, net charge-offs,
reductions in new home construction and continued risk mitigation initiatives.
At December 31, 2010, homebuilder nonperforming loans and foreclosed
properties declined $1.3 billion due to repayments, net charge-offs, fewer risk
rating downgrades and a slowdown in the rate of home price declines com-
pared to December 31, 2009. Homebuilder utilized reservable criticized
exposure decreased by $2.3 billion to $3.4 billion due to repayments and
net charge-offs. The nonperforming loans, leases and foreclosed properties
and the utilized reservable criticized ratios for the homebuilder portfolio were
42.80 percent and 74.27 percent at December 31, 2010 compared to
42.16 percent and 74.44 percent at December 31, 2009. Net charge-offs
for the homebuilder portfolio decreased $872 million in 2010 compared to
2009.
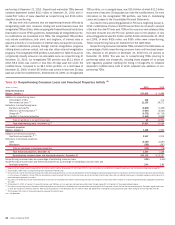
At December 31, 2010 and 2009, the commercial real estate loan
portfolio included $19.1 billion and $27.4 billion of funded construction
and land development loans that were originated to fund the construction
and/or rehabilitation of commercial properties. This portfolio is mostly se-
cured and diversified across property types and geographies but faces sig-
nificant challenges in the current housing and rental markets. Weak rental
Bank of America 2010 91