Bank of America 2010 Annual Report Download - page 117
Download and view the complete annual report
Please find page 117 of the 2010 Bank of America annual report below. You can navigate through the pages in the report by either clicking on the pages listed below, or by using the keyword search tool below to find specific information within the annual report.-
 1
1 -
2
-
3
-
4
-
5
-
6
-
7
-
8
-
9
-
10
-
11
-
12
-
13
-
14
-
15
-
16
-
17
-
18
-
19
-
20
-
21
-
22
-
23
-
24
-
25
-
26
-
27
-
28
-
29
-
30
-
31
-
32
-
33
-
34
-
35
-
36
-
37
-
38
-
39
-
40
-
41
-
42
-
43
-
44
-
45
-
46
-
47
-
48
-
49
-
50
-
51
-
52
-
53
-
54
-
55
-
56
-
57
-
58
-
59
-
60
-
61
-
62
-
63
-
64
-
65
-
66
-
67
-
68
-
69
-
70
-
71
-
72
-
73
-
74
-
75
-
76
-
77
-
78
-
79
-
80
-
81
-
82
-
83
-
84
-
85
-
86
-
87
-
88
-
89
-
90
-
91
-
92
-
93
-
94
-
95
-
96
-
97
-
98
-
99
-
100
-
101
-
102
-
103
-
104
-
105
-
106
-
 107
107 -
 108
108 -
 109
109 -
 110
110 -
 111
111 -
 112
112 -
 113
113 -
 114
114 -
 115
115 -
 116
116 -
 117
117 -
 118
118 -
 119
119 -
 120
120 -
 121
121 -
 122
122 -
 123
123 -
 124
124 -
 125
125 -
 126
126 -
 127
127 -
128
-
129
-
130
-
131
-
132
-
133
-
134
-
135
-
136
-
137
-
138
-
139
-
140
-
141
-
142
-
143
-
144
-
145
-
146
-
147
-
148
-
149
-
150
-
151
-
152
-
153
-
154
-
155
-
156
-
157
-
158
-
159
-
160
-
161
-
162
-
163
-
164
-
165
-
166
-
167
-
168
-
169
-
170
-
171
-
172
-
173
-
174
-
175
-
176
-
177
-
178
-
179
-
180
-
181
-
182
-
183
-
184
-
185
-
186
-
187
-
188
-
189
-
190
-
191
-
192
-
193
-
194
-
195
-
196
-
197
-
198
-
199
-
200
-
201
-
202
-
203
-
204
-
205
-
206
-
207
-
208
-
209
-
210
-
211
-
212
-
213
-
214
-
215
-
216
-
217
-
218
-
219
-
220
-
221
-
222
-
223
-
224
-
225
-
226
-
227
-
228
-
229
-
230
-
231
-
232
-
233
-
234
-
235
-
236
-
237
-
238
-
239
-
240
-
241
-
242
-
243
-
244
-
245
-
246
-
247
-
248
-
249
-
250
-
251
-
252
 |
 |
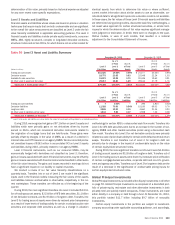
discount rate, terminal value, expected loss rates and expected new account
growth. We also updated our estimated cash flow valuation to reflect the
current strategic plan and other portfolio assumptions. Based on the results
of step one of the impairment test, we determined that the carrying amount of
Global Card Services, including goodwill, exceeded the fair value. The carrying
amount, fair value and goodwill of the reporting unit were $39.2 billion,
$25.9 billion and $22.3 billion, respectively. Accordingly, we performed step
two of the goodwill impairment test for this reporting unit. In step two, we
compared the implied fair value of the reporting unit’s goodwill with the
carrying amount of that goodwill. Under step two of the impairment test,
significant assumptions in measuring the fair value of the assets and liabil-
ities including discount rates, loss rates and interest rates were updated to
reflect the current economic conditions. Based on the results of this third-
quarter goodwill impairment test for Global Card Services, the carrying value
of the goodwill assigned to the reporting unit exceeded the implied fair value
by $10.4 billion. Accordingly, we recorded a non-cash, non-tax deductible
goodwill impairment charge of $10.4 billion to reduce the carrying value of
goodwill in Global Card Services from $22.3 billion to $11.9 billion. The
goodwill impairment test included limited mitigation actions to recapture lost
revenue. Although we have identified other potential mitigation actions within
Global Card Services, the impact of these actions going forward did not
reduce the goodwill impairment charge because these actions are in the early
stages of development and, additionally, certain of them may impact seg-
ments other than Global Card Services (e.g., Deposits). The impairment
charge had no impact on the Corporation’s reported Tier 1 and tangible equity
ratios.
Due to the continued stress on Global Card Services as a result of the
Financial Reform Act, we concluded that an additional impairment analysis
should be performed for this reporting unit during the three months ended
December 31, 2010. In step one of the goodwill impairment test, the fair
value of Global Card Services was estimated under the income approach. The
significant assumptions under the income approach included the discount
rate, terminal value, expected loss rates and expected new account growth.
The carrying amount, fair value and goodwill for the Global Card Services
reporting unit were $27.5 billion, $27.6 billion and $11.9 billion, respectively.
The estimated fair value as a percent of the carrying amount at December 31,
2010 was 100 percent. Although fair value exceeded the carrying amount in
step one of the Global Card Services goodwill impairment test, to further
substantiate the value of goodwill, we also performed the step two test for
this reporting unit. Under step two of the goodwill impairment test for this
reporting unit, significant assumptions in measuring the fair value of the
assets and liabilities of the reporting unit including discount rates, loss rates
and interest rates were updated to reflect the current economic conditions.
The results of step two of the goodwill impairment test indicated that remain-
ing balance of goodwill of $11.9 billion was not impaired as of December 31,
2010.
On December 16, 2010, the Federal Reserve released proposed regula-
tions to implement the Durbin Amendment of the Financial Reform Act, which
are scheduled to be effective July 21, 2011. The proposed rule includes two
alternative interchange fee standards that would apply to all covered issuers:
one based on each issuer’s costs, with a safe harbor initially set at $0.07 per
transaction and a cap initially set at $0.12 per transaction; and the other a
stand-alone cap initially set at $0.12 per transaction. See Regulatory Matters
beginning on page 60 for additional information. Although the range of
revenue loss estimate based on the proposed rule was slightly higher than
our original estimate of $2.0 billion, given the uncertainty around the potential
outcome, we did not change the revenue loss estimate used in the goodwill
impairment test during the three months ended December 31, 2010. If the
final Federal Reserve rule sets interchange fee standards that are significantly
lower than the interchange fee assumptions we used in this goodwill impair-
ment test, we will be required to perform an additional goodwill impairment
test which may result in additional impairment of goodwill in Global Card
Services. In view of the uncertainty with model inputs including the final ruling,
changes in the economic outlook and the corresponding impact to revenues
and asset quality, and the impacts of mitigation actions, it is not possible to
estimate the amount or range of amounts of additional goodwill impairment, if
any.
Home Loans & Insurance Impairment
During the three months ended December 31, 2010, we performed an
impairment test for the Home Loans & Insurance reporting unit as it was
likely that there was a decline in its fair value as a result of increased
uncertainties, including existing and potential litigation exposure and other
related risks, higher current servicing costs including loss mitigation efforts,
foreclosure related issues and the redeployment of centralized sales re-
sources to address servicing needs. In step one of the goodwill impairment
test, the fair value of Home Loans & Insurance was estimated based on a
combination of the market approach and the income approach. Under the
market approach valuation, significant assumptions included market multi-
ples and a control premium. The significant assumptions for the valuation of
Home Loans & Insurance under the income approach included cash flow
estimates, the discount rate and the terminal value. These assumptions were
updated to reflect the current strategic plan forecast and to address the
increased uncertainties referenced above. Based on the results of step one of
the impairment test,we determined that the carrying amount of Home
Loans & Insurance, including goodwill, exceeded the fair value. The carrying
amount, fair value and goodwill for the Home Loans & Insurance reporting unit
were $24.7 billion, $15.1 billion and $4.8 billion, respectively. Accordingly, we
performed step two of the goodwill impairment test for this reporting unit. In
step two, we compared the implied fair value of the reporting unit’s goodwill
with the carrying amount of that goodwill. Under step two of the goodwill
impairment test, significant assumptions in measuring the fair value of the
assets and liabilities of the reporting unit including discount rates, loss rates
and interest rates were updated to reflect the current economic conditions.
Based on the results of step two of the impairment test, the carrying value of
the goodwill assigned to Home Loans & Insurance exceeded the implied fair
value by $2.0 billion. Accordingly, we recorded a non-cash, non-tax deductible
goodwill impairment charge of $2.0 billion as of December 31, 2010 to
reduce the carrying value of goodwill in the Home Loans & Insurance reporting
unit. The impairment charge had no impact on the Corporation’s Tier 1 and
tangible equity ratios.
As we obtain additional information relative to our litigation exposure,
representations and warranties repurchase obligations, servicing costs and
foreclosure related issues, it is possible that such information, if significantly
different than the assumptions used in this goodwill impairment test, may
result in additional impairment in the Home Loans & Insurance reporting unit.
Annual Impairment Test for 2010
We perform our annual goodwill impairment test for all reporting units as of
June 30 each year. In performing the first step of the June 30, 2010 annual
impairment test, we compared the fair value of each reporting unit to its
current carrying amount, including goodwill. To determine fair value, we
utilized a combination of a market approach and an income approach. Under
the market approach, we compared earnings and equity multiples of the
individual reporting units to multiples of publicly traded companies compa-
rable to the individual reporting units. The control premiums used in the
June 30, 2010 annual impairment test ranged from 25 to 35 percent. Under
the income approach, we updated our assumptions to reflect the current
market environment. The discount rates used in the June 30, 2010 annual
impairment test ranged from 11 to 15 percent depending on the relative risk
of a reporting unit. Because growth rates developed by management for
Bank of America 2010 115