Bank of America 2010 Annual Report Download - page 38
Download and view the complete annual report
Please find page 38 of the 2010 Bank of America annual report below. You can navigate through the pages in the report by either clicking on the pages listed below, or by using the keyword search tool below to find specific information within the annual report.-
 1
1 -
2
-
3
-
4
-
5
-
6
-
7
-
8
-
9
-
10
-
11
-
12
-
13
-
14
-
15
-
16
-
17
-
18
-
19
-
20
-
21
-
22
-
23
-
24
-
25
-
26
-
27
-
 28
28 -
 29
29 -
 30
30 -
 31
31 -
 32
32 -
 33
33 -
 34
34 -
 35
35 -
 36
36 -
 37
37 -
 38
38 -
 39
39 -
 40
40 -
 41
41 -
 42
42 -
 43
43 -
 44
44 -
 45
45 -
 46
46 -
 47
47 -
 48
48 -
49
-
50
-
51
-
52
-
53
-
54
-
55
-
56
-
57
-
58
-
59
-
60
-
61
-
62
-
63
-
64
-
65
-
66
-
67
-
68
-
69
-
70
-
71
-
72
-
73
-
74
-
75
-
76
-
77
-
78
-
79
-
80
-
81
-
82
-
83
-
84
-
85
-
86
-
87
-
88
-
89
-
90
-
91
-
92
-
93
-
94
-
95
-
96
-
97
-
98
-
99
-
100
-
101
-
102
-
103
-
104
-
105
-
106
-
107
-
108
-
109
-
110
-
111
-
112
-
113
-
114
-
115
-
116
-
117
-
118
-
119
-
120
-
121
-
122
-
123
-
124
-
125
-
126
-
127
-
128
-
129
-
130
-
131
-
132
-
133
-
134
-
135
-
136
-
137
-
138
-
139
-
140
-
141
-
142
-
143
-
144
-
145
-
146
-
147
-
148
-
149
-
150
-
151
-
152
-
153
-
154
-
155
-
156
-
157
-
158
-
159
-
160
-
161
-
162
-
163
-
164
-
165
-
166
-
167
-
168
-
169
-
170
-
171
-
172
-
173
-
174
-
175
-
176
-
177
-
178
-
179
-
180
-
181
-
182
-
183
-
184
-
185
-
186
-
187
-
188
-
189
-
190
-
191
-
192
-
193
-
194
-
195
-
196
-
197
-
198
-
199
-
200
-
201
-
202
-
203
-
204
-
205
-
206
-
207
-
208
-
209
-
210
-
211
-
212
-
213
-
214
-
215
-
216
-
217
-
218
-
219
-
220
-
221
-
222
-
223
-
224
-
225
-
226
-
227
-
228
-
229
-
230
-
231
-
232
-
233
-
234
-
235
-
236
-
237
-
238
-
239
-
240
-
241
-
242
-
243
-
244
-
245
-
246
-
247
-
248
-
249
-
250
-
251
-
252
 |
 |

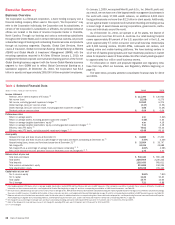
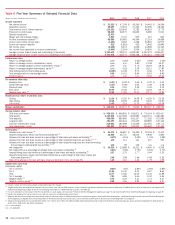
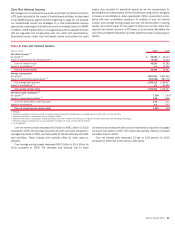
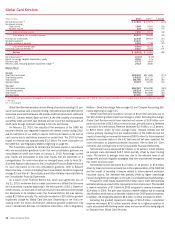
Table 6 Five Year Summary of Selected Financial Data
(Dollars in millions, except per share information)
2010 2009 2008 2007 2006
Income statement
Net interest income
$51,523
$ 47,109 $ 45,360 $ 34,441 $ 34,594
Noninterest income
58,697
72,534 27,422 32,392 38,182
Total revenue, net of interest expense
110,220
119,643 72,782 66,833 72,776
Provision for credit losses
28,435
48,570 26,825 8,385 5,010
Goodwill impairment
12,400
––––
Merger and restructuring charges
1,820
2,721 935 410 805
All other noninterest expense
(1)
68,888
63,992 40,594 37,114 34,988
Income (loss) before income taxes
(1,323)
4,360 4,428 20,924 31,973
Income tax expense (benefit)
915
(1,916) 420 5,942 10,840
Net income (loss)
(2,238)
6,276 4,008 14,982 21,133
Net income (loss) applicable to common shareholders
(3,595)
(2,204) 2,556 14,800 21,111
Average common shares issued and outstanding (in thousands)
9,790,472
7,728,570 4,592,085 4,423,579 4,526,637
Average diluted common shares issued and outstanding (in thousands)
9,790,472
7,728,570 4,596,428 4,463,213 4,580,558
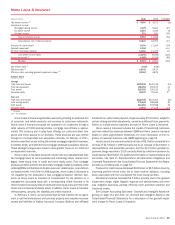
Performance ratios
Return on average assets
n/m
0.26% 0.22% 0.94% 1.44%
Return on average common shareholders’ equity
n/m
n/m 1.80 11.08 16.27
Return on average tangible common shareholders’ equity
(2)
n/m
n/m 4.72 26.19 38.23
Return on average tangible shareholders’ equity
(2)
n/m
4.18 5.19 25.13 37.80
Total ending equity to total ending assets
10.08%
10.38 9.74 8.56 9.27
Total average equity to total average assets
9.56
10.01 8.94 8.53 8.90
Dividend payout
n/m
n/m n/m 72.26 45.66
Per common share data
Earnings (loss)
$ (0.37)
$ (0.29) $ 0.54 $ 3.32 $ 4.63
Diluted earnings (loss)
(0.37)
(0.29) 0.54 3.29 4.58
Dividends paid
0.04
0.04 2.24 2.40 2.12
Book value
20.99
21.48 27.77 32.09 29.70
Tangible book value
(2)
12.98
11.94 10.11 12.71 13.26
Market price per share of common stock
Closing
$13.34
$15.06$14.08$41.26$53.39
High closing
19.48
18.59 45.03 54.05 54.90
Low closing
10.95
3.14 11.25 41.10 43.09
Market capitalization
$ 134,536
$ 130,273 $ 70,645 $ 183,107 $ 238,021
Average balance sheet
Total loans and leases
$ 958,331
$ 948,805 $ 910,871 $ 776,154 $ 652,417
Total assets
2,439,602
2,443,068 1,843,985 1,602,073 1,466,681
Total deposits
988,586
980,966 831,157 717,182 672,995
Long-term debt
490,497
446,634 231,235 169,855 130,124
Common shareholders’ equity
212,681
182,288 141,638 133,555 129,773
Total shareholders’ equity
233,231
244,645 164,831 136,662 130,463
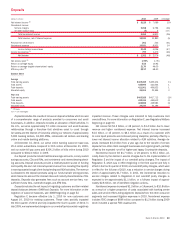
Asset quality
(3)
Allowance for credit losses
(4)
$43,073
$ 38,687 $ 23,492 $ 12,106 $ 9,413
Nonperforming loans, leases and foreclosed properties
(5)
32,664
35,747 18,212 5,948 1,856
Allowance for loan and lease losses as a percentage of total loans and leases outstanding
(5)
4.47%
4.16% 2.49% 1.33% 1.28%
Allowance for loan and lease losses as a percentage of total nonperforming loans and leases
(5, 6)
136
111 141 207 505
Allowance for loan and lease losses as a percentage of total nonperforming loans and leases excluding
the purchased credit-impaired loan portfolio
(5, 6)
116
99 136 n/a n/a
Net charge-offs
$34,334
$ 33,688 $ 16,231 $ 6,480 $ 4,539
Net charge-offs as a percentage of average loans and leases outstanding
(5)
3.60%
3.58% 1.79% 0.84% 0.70%
Nonperforming loans and leases as a percentage of total loans and leases outstanding
(5)
3.27
3.75 1.77 0.64 0.25
Nonperforming loans, leases and foreclosed properties as a percentage of total loans, leases and
foreclosed properties
(5)
3.48
3.98 1.96 0.68 0.26
Ratio of the allowance for loan and lease losses at December 31 to net charge-offs
1.22
1.10 1.42 1.79 1.99
Capital ratios (year end)
Risk-based capital:
Tier 1 common
8.60%
7.81% 4.80% 4.93% 6.82%
Tier 1
11.24
10.40 9.15 6.87 8.64
Total
15.77
14.66 13.00 11.02 11.88
Tier 1 leverage
7.21
6.88 6.44 5.04 6.36
Tangible equity
(2)
6.75
6.40 5.11 3.73 4.47
Tangible common equity
(2)
5.99
5.56 2.93 3.46 4.27
(1)
Excludes merger and restructuring charges and goodwill impairment charges.
(2)
Tangible equity ratios and tangible book value per share of common stock are non-GAAP measures. Other companies may define or calculate these measures differently. For additional information on these ratios, see Supplemental
Financial Data beginning on page 40 and for corresponding reconciliations to GAAP financial measures, see Table XIII.
(3)
For more information on the impact of the PCI loan portfolio on asset quality, see Consumer Portfolio Credit Risk Management beginning on page 76 and Commercial Portfolio Credit Risk Management beginning on page 87.
(4)
Includes the allowance for loan and lease losses and the reserve for unfunded lending commitments.
(5)
Balances and ratios do not include loans accounted for under the fair value option. For additional exclusions on nonperforming loans, leases and foreclosed properties, see Nonperforming Consumer Loans and Foreclosed Properties
Activity beginning on page 85 and corresponding Table 33 and Nonperforming Commercial Loans, Leases and Foreclosed Properties Activity and corresponding Table 41 on page 93.
(6)
Allowance for loan and lease losses includes $22.9 billion, $17.7 billion, $11.7 billion, $6.5 billion and $5.4 billion allocated to products that are excludedfrom nonperformingloans, leases and foreclosed properties at December 31,
2010, 2009, 2008, 2007 and 2006, respectively.
n/m = not meaningful
n/a = not applicable
36 Bank of America 2010