Bank of America 2010 Annual Report Download - page 147
Download and view the complete annual report
Please find page 147 of the 2010 Bank of America annual report below. You can navigate through the pages in the report by either clicking on the pages listed below, or by using the keyword search tool below to find specific information within the annual report.-
 1
1 -
2
-
3
-
4
-
5
-
6
-
7
-
8
-
9
-
10
-
11
-
12
-
13
-
14
-
15
-
16
-
17
-
18
-
19
-
20
-
21
-
22
-
23
-
24
-
25
-
26
-
27
-
28
-
29
-
30
-
31
-
32
-
33
-
34
-
35
-
36
-
37
-
38
-
39
-
40
-
41
-
42
-
43
-
44
-
45
-
46
-
47
-
48
-
49
-
50
-
51
-
52
-
53
-
54
-
55
-
56
-
57
-
58
-
59
-
60
-
61
-
62
-
63
-
64
-
65
-
66
-
67
-
68
-
69
-
70
-
71
-
72
-
73
-
74
-
75
-
76
-
77
-
78
-
79
-
80
-
81
-
82
-
83
-
84
-
85
-
86
-
87
-
88
-
89
-
90
-
91
-
92
-
93
-
94
-
95
-
96
-
97
-
98
-
99
-
100
-
101
-
102
-
103
-
104
-
105
-
106
-
107
-
108
-
109
-
110
-
111
-
112
-
113
-
114
-
115
-
116
-
117
-
118
-
119
-
120
-
121
-
122
-
123
-
124
-
125
-
126
-
127
-
128
-
129
-
130
-
131
-
132
-
133
-
134
-
135
-
136
-
 137
137 -
 138
138 -
 139
139 -
 140
140 -
 141
141 -
 142
142 -
 143
143 -
 144
144 -
 145
145 -
 146
146 -
 147
147 -
 148
148 -
 149
149 -
 150
150 -
 151
151 -
 152
152 -
 153
153 -
 154
154 -
 155
155 -
 156
156 -
 157
157 -
158
-
159
-
160
-
161
-
162
-
163
-
164
-
165
-
166
-
167
-
168
-
169
-
170
-
171
-
172
-
173
-
174
-
175
-
176
-
177
-
178
-
179
-
180
-
181
-
182
-
183
-
184
-
185
-
186
-
187
-
188
-
189
-
190
-
191
-
192
-
193
-
194
-
195
-
196
-
197
-
198
-
199
-
200
-
201
-
202
-
203
-
204
-
205
-
206
-
207
-
208
-
209
-
210
-
211
-
212
-
213
-
214
-
215
-
216
-
217
-
218
-
219
-
220
-
221
-
222
-
223
-
224
-
225
-
226
-
227
-
228
-
229
-
230
-
231
-
232
-
233
-
234
-
235
-
236
-
237
-
238
-
239
-
240
-
241
-
242
-
243
-
244
-
245
-
246
-
247
-
248
-
249
-
250
-
251
-
252
 |
 |

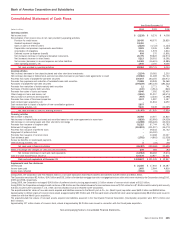
Bank of America Corporation and Subsidiaries
Consolidated Statement of Cash Flows
(Dollars in millions)
2010 2009 2008
Year Ended December 31
Operating activities
Net income (loss)
$ (2,238)
$6,276$4,008
Reconciliation of net income (loss) to net cash provided by operating activities:
Provision for credit losses
28,435
48,570 26,825
Goodwill impairment charges
12,400
––
Gains on sales of debt securities
(2,526)
(4,723) (1,124)
Depreciation and premises improvements amortization
2,181
2,336 1,485
Amortization of intangibles
1,731
1,978 1,834
Deferred income tax expense (benefit)
608
370 (5,801)
Net (increase) decrease in trading and derivative instruments
20,775
59,822 (16,973)
Net (increase) decrease in other assets
5,213
28,553 (6,391)
Net increase (decrease) in accrued expenses and other liabilities
14,069
(16,601) (8,885)
Other operating activities, net
1,946
3,150 9,056
Net cash provided by operating activities
82,594
129,731 4,034
Investing activities
Net (increase) decrease in time deposits placed and other short-term investments
(2,154)
19,081 2,203
Net (increase) decrease in federal funds sold and securities borrowed or purchased under agreements to resell
(19,683)
31,369 53,723
Proceeds from sales of available-for-sale debt securities
100,047
164,155 120,972
Proceeds from paydowns and maturities of available-for-sale debt securities
70,868
59,949 26,068
Purchases of available-for-sale debt securities
(199,159)
(185,145) (184,232)
Proceeds from maturities of held-to-maturity debt securities
11
2,771 741
Purchases of held-to-maturity debt securities
(100)
(3,914) (840)
Proceeds from sales of loans and leases
8,046
7,592 52,455
Other changes in loans and leases, net
(2,550)
21,257 (69,574)
Net purchases of premises and equipment
(987)
(2,240) (2,098)
Proceeds from sales of foreclosed properties
3,107
1,997 1,187
Cash received upon acquisition, net
–
31,804 6,650
Cash received due to impact of adoption of new consolidation guidance
2,807
––
Other investing activities, net
9,400
9,249 (10,185)
Net cash provided by (used in) investing activities
(30,347)
157,925 (2,930)
Financing activities
Net increase in deposits
36,598
10,507 14,830
Net decrease in federal funds purchased and securities loaned or sold under agreements to repurchase
(9,826)
(62,993) (34,529)
Net decrease in commercial paper and other short-term borrowings
(31,698)
(126,426) (33,033)
Proceeds from issuance of long-term debt
52,215
67,744 43,782
Retirement of long-term debt
(110,919)
(101,207) (35,072)
Proceeds from issuance of preferred stock
–
49,244 34,742
Repayment of preferred stock
–
(45,000) –
Proceeds from issuance of common stock
–
13,468 10,127
Cash dividends paid
(1,762)
(4,863) (11,528)
Excess tax benefits on share-based payments
–
–42
Other financing activities, net
5
(42) (56)
Net cash used in financing activities
(65,387)
(199,568) (10,695)
Effect of exchange rate changes on cash and cash equivalents
228
394 (83)
Net increase (decrease) in cash and cash equivalents
(12,912)
88,482 (9,674)
Cash and cash equivalents at January 1
121,339
32,857 42,531
Cash and cash equivalents at December 31
$ 108,427
$ 121,339 $ 32,857
Supplemental cash flow disclosures
Interest paid
$21,166
$ 37,602 $ 36,387
Income taxes paid
1,465
2,964 4,816
Income taxes refunded
(7,783)
(31) (116)
During 2010, the Corporation sold First Republic Bank in a non-cash transaction that reduced assets and liabilities by $19.5 billion and $18.1 billion.
The Corporation securitized $2.4 billion, $14.0 billion and $26.1 billion of residential mortgage loans into mortgage-backed securities which were retained by the Corporation during 2010,
2009 and 2008, respectively.
During 2009, the Corporation exchanged $14.8 billion of preferred stock by issuing approximately 1.0 billion shares of common stock valued at $11.5 billion.
During 2009, the Corporation exchanged credit card loans of $8.5 billion and the related allowance for loan and lease losses of $750 million for a $7.8 billion held-to-maturity debt security
that was issued by the Corporation’s U.S. credit card securitization trust and retained by the Corporation.
The acquisition-date fair values of non-cash assets acquired and liabilities assumed in the Merrill Lynch & Co., Inc. (Merrill Lynch) acquisition were $619.1 billion and $626.8 billion.
Approximately 1.4 billion shares of common stock valued at approximately $20.5 billion and 376 thousand shares of preferred stock valued at approximately $8.6 billion were issued in
connection with the Merrill Lynch acquisition.
The acquisition-date fair values of non-cash assets acquired and liabilities assumed in the Countrywide Financial Corporation (Countrywide) acquisition were $157.4 billion and
$157.8 billion.
Approximately 107 million shares of common stock, valued at approximately $4.2 billion were issued in connection with the Countrywide acquisition.
See accompanying Notes to Consolidated Financial Statements.
Bank of America 2010 145