Bank of America 2010 Annual Report Download - page 222
Download and view the complete annual report
Please find page 222 of the 2010 Bank of America annual report below. You can navigate through the pages in the report by either clicking on the pages listed below, or by using the keyword search tool below to find specific information within the annual report.-
 1
1 -
2
-
3
-
4
-
5
-
6
-
7
-
8
-
9
-
10
-
11
-
12
-
13
-
14
-
15
-
16
-
17
-
18
-
19
-
20
-
21
-
22
-
23
-
24
-
25
-
26
-
27
-
28
-
29
-
30
-
31
-
32
-
33
-
34
-
35
-
36
-
37
-
38
-
39
-
40
-
41
-
42
-
43
-
44
-
45
-
46
-
47
-
48
-
49
-
50
-
51
-
52
-
53
-
54
-
55
-
56
-
57
-
58
-
59
-
60
-
61
-
62
-
63
-
64
-
65
-
66
-
67
-
68
-
69
-
70
-
71
-
72
-
73
-
74
-
75
-
76
-
77
-
78
-
79
-
80
-
81
-
82
-
83
-
84
-
85
-
86
-
87
-
88
-
89
-
90
-
91
-
92
-
93
-
94
-
95
-
96
-
97
-
98
-
99
-
100
-
101
-
102
-
103
-
104
-
105
-
106
-
107
-
108
-
109
-
110
-
111
-
112
-
113
-
114
-
115
-
116
-
117
-
118
-
119
-
120
-
121
-
122
-
123
-
124
-
125
-
126
-
127
-
128
-
129
-
130
-
131
-
132
-
133
-
134
-
135
-
136
-
137
-
138
-
139
-
140
-
141
-
142
-
143
-
144
-
145
-
146
-
147
-
148
-
149
-
150
-
151
-
152
-
153
-
154
-
155
-
156
-
157
-
158
-
159
-
160
-
161
-
162
-
163
-
164
-
165
-
166
-
167
-
168
-
169
-
170
-
171
-
172
-
173
-
174
-
175
-
176
-
177
-
178
-
179
-
180
-
181
-
182
-
183
-
184
-
185
-
186
-
187
-
188
-
189
-
190
-
191
-
192
-
193
-
194
-
195
-
196
-
197
-
198
-
199
-
200
-
201
-
202
-
203
-
204
-
205
-
206
-
207
-
208
-
209
-
210
-
211
-
 212
212 -
 213
213 -
 214
214 -
 215
215 -
 216
216 -
 217
217 -
 218
218 -
 219
219 -
 220
220 -
 221
221 -
 222
222 -
 223
223 -
 224
224 -
 225
225 -
 226
226 -
 227
227 -
 228
228 -
 229
229 -
 230
230 -
 231
231 -
 232
232 -
233
-
234
-
235
-
236
-
237
-
238
-
239
-
240
-
241
-
242
-
243
-
244
-
245
-
246
-
247
-
248
-
249
-
250
-
251
-
252
 |
 |

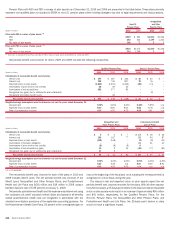
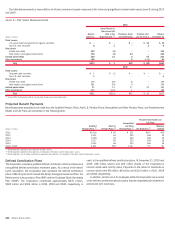
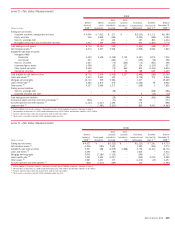
The table below presents a reconciliation of all plan investment assets measured at fair value using significant unobservable inputs (Level 3) during2010
and 2009.
Level 3 – Fair Value Measurements
(Dollars in millions)
Balance
January 1
Actual Return on
Plan Assets Still
Held at the
Reporting Date
(1)
Purchases, Sales
and Settlements
Transfers into/
(out of) Level 3
Balance
December 31
2010
Fixed income
U.S. government and government agency securities
$– $ – $– $14 $14
Non-U.S. debt securities
61–29
Real estate
Private real estate
119 (9) – – 110
Real estate commingled/mutual funds
195 (4) 24 – 215
Limited partnerships 162 13 2 53 230
Other investments 188 – 6 (111) 83
Total $670 $ 1 $32 $ (42) $661
2009
Fixed income
Corporate debt securities $ 1 $ (1) $ – $ – $ –
Non-U.S. debt securities 6 – – – 6
Real estate
Private real estate 149 (29) (1) – 119
Real estate commingled/mutual funds 281 (92) 6 – 195
Limited partnerships
91 14 37 20 162
Other investments
293 (106) 1 – 188
Total
$821 $(214) $43 $ 20 $670
(1)
During 2009, the Corporation did not sell any Level 3 plan assets during the period.
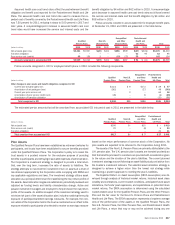
Projected Benefit Payments
Benefit payments projected to be made from the Qualified Pension Plans, Non-U.S. Pension Plans, Nonqualified and Other Pension Plans, and Postretirement
Health and Life Plans are presented in the following table.
(Dollars in millions)
Qualified
Pension Plans
(1)
Non-U.S.
Pension Plans
(2)
Nonqualified
and Other
Pension Plans
(2)
Net Payments
(3)
Medicare
Subsidy
Postretirement Health and
Life Plans
2011 $1,016 $ 60 $ 231 $167 $19
2012 1,031 62 250 168 19
2013 1,038 63 242 168 19
2014 1,037 65 232 168 19
2015 1,041 66 235 166 18
2016 – 2020 5,231 350 1,147 757 87
(1)
Benefit payments expected to be made from the plans’ assets.
(2)
Benefit payments expected to be made from a combination of the plans’ and the Corporation’s assets.
(3)
Benefit payments (net of retiree contributions) expected to be made from a combination of the plans’ and the Corporation’s assets.
Defined Contribution Plans
The Corporation maintains qualified defined contribution retirement plans and
nonqualified defined contribution retirement plans. As a result of the Merrill
Lynch acquisition, the Corporation also maintains the defined contribution
plans of Merrill Lynch which include the 401(k) Savings & Investment Plan, the
Retirement and Accumulation Plan (RAP) and the Employee Stock Ownership
Plan (ESOP). The Corporation contributed approximately $670 million,
$605 million and $454 million in 2010, 2009 and 2008, respectively, in
cash, to the qualified defined contribution plans. At December 31, 2010 and
2009, 208 million shares and 203 million shares of the Corporation’s
common stock were held by plans. Payments to the plans for dividends on
common stock were $8 million, $8 million and $214 million in 2010, 2009
and 2008, respectively.
In addition, certain non-U.S. employees within the Corporation are covered
under defined contribution pension plans that are separately administered in
accordance with local laws.
220 Bank of America 2010