Bank of America 2010 Annual Report Download - page 132
Download and view the complete annual report
Please find page 132 of the 2010 Bank of America annual report below. You can navigate through the pages in the report by either clicking on the pages listed below, or by using the keyword search tool below to find specific information within the annual report.-
 1
1 -
2
-
3
-
4
-
5
-
6
-
7
-
8
-
9
-
10
-
11
-
12
-
13
-
14
-
15
-
16
-
17
-
18
-
19
-
20
-
21
-
22
-
23
-
24
-
25
-
26
-
27
-
28
-
29
-
30
-
31
-
32
-
33
-
34
-
35
-
36
-
37
-
38
-
39
-
40
-
41
-
42
-
43
-
44
-
45
-
46
-
47
-
48
-
49
-
50
-
51
-
52
-
53
-
54
-
55
-
56
-
57
-
58
-
59
-
60
-
61
-
62
-
63
-
64
-
65
-
66
-
67
-
68
-
69
-
70
-
71
-
72
-
73
-
74
-
75
-
76
-
77
-
78
-
79
-
80
-
81
-
82
-
83
-
84
-
85
-
86
-
87
-
88
-
89
-
90
-
91
-
92
-
93
-
94
-
95
-
96
-
97
-
98
-
99
-
100
-
101
-
102
-
103
-
104
-
105
-
106
-
107
-
108
-
109
-
110
-
111
-
112
-
113
-
114
-
115
-
116
-
117
-
118
-
119
-
120
-
121
-
 122
122 -
 123
123 -
 124
124 -
 125
125 -
 126
126 -
 127
127 -
 128
128 -
 129
129 -
 130
130 -
 131
131 -
 132
132 -
 133
133 -
 134
134 -
 135
135 -
 136
136 -
 137
137 -
 138
138 -
 139
139 -
 140
140 -
 141
141 -
 142
142 -
143
-
144
-
145
-
146
-
147
-
148
-
149
-
150
-
151
-
152
-
153
-
154
-
155
-
156
-
157
-
158
-
159
-
160
-
161
-
162
-
163
-
164
-
165
-
166
-
167
-
168
-
169
-
170
-
171
-
172
-
173
-
174
-
175
-
176
-
177
-
178
-
179
-
180
-
181
-
182
-
183
-
184
-
185
-
186
-
187
-
188
-
189
-
190
-
191
-
192
-
193
-
194
-
195
-
196
-
197
-
198
-
199
-
200
-
201
-
202
-
203
-
204
-
205
-
206
-
207
-
208
-
209
-
210
-
211
-
212
-
213
-
214
-
215
-
216
-
217
-
218
-
219
-
220
-
221
-
222
-
223
-
224
-
225
-
226
-
227
-
228
-
229
-
230
-
231
-
232
-
233
-
234
-
235
-
236
-
237
-
238
-
239
-
240
-
241
-
242
-
243
-
244
-
245
-
246
-
247
-
248
-
249
-
250
-
251
-
252
 |
 |

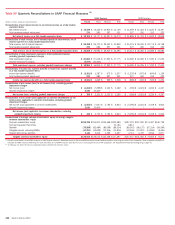
Table XIII Five Year Reconciliations to GAAP Financial Measures
(1)
(Dollars in millions, except per share information)
2010 2009 2008 2007 2006
Reconciliation of net interest income to net interest income on a fully taxable-equivalent basis
Net interest income
$51,523
$ 47,109 $ 45,360 $ 34,441 $ 34,594
Fully taxable-equivalent adjustment
1,170
1,301 1,194 1,749 1,224
Net interest income on a fully taxable-equivalent basis
$52,693
$ 48,410 $ 46,554 $ 36,190 $ 35,818
Reconciliation of total revenue, net of interest expense to total revenue, net of interest expense on a fully
taxable-equivalent basis
Total revenue, net of interest expense
$110,220
$ 119,643 $ 72,782 $ 66,833 $ 72,776
Fully taxable-equivalent adjustment
1,170
1,301 1,194 1,749 1,224
Total revenue, net of interest expense on a fully taxable-equivalent basis
$111,390
$ 120,944 $ 73,976 $ 68,582 $ 74,000
Reconciliation of total noninterest expense to total noninterest expense, excluding goodwill impairment
charges
Total noninterest expense
$83,108
$ 66,713 $ 41,529 $ 37,524 $ 35,793
Goodwill impairment charges
(12,400)
––––
Total noninterest expense, excluding goodwill impairment charges
$70,708
$ 66,713 $ 41,529 $ 37,524 $ 35,793
Reconciliation of income tax expense (benefit) to income tax expense (benefit) on a fully taxable-
equivalent basis
Income tax expense (benefit)
$915
$ (1,916) $ 420 $ 5,942 $ 10,840
Fully taxable-equivalent adjustment
1,170
1,301 1,194 1,749 1,224
Income tax expense (benefit) on a fully taxable-equivalent basis
$2,085
$ (615) $ 1,614 $ 7,691 $ 12,064
Reconciliation of net income (loss) to net income, excluding goodwill impairment charges
Net income (loss)
$(2,238)
$ 6,276 $ 4,008 $ 14,982 $ 21,133
Goodwill impairment charges
12,400
––––
Net income, excluding goodwill impairment charges
$10,162
$ 6,276 $ 4,008 $ 14,982 $ 21,133
Reconciliation of net income (loss) applicable to common shareholders to net income (loss) applicable to
common shareholders, excluding goodwill impairment charges
Net income (loss) applicable to common shareholders
$(3,595)
$ (2,204) $ 2,556 $ 14,800 $ 21,111
Goodwill impairment charges
12,400
––––
Net income (loss) applicable to common shareholders, excluding goodwill impairment charges
$8,805
$ (2,204) $ 2,556 $ 14,800 $ 21,111
Reconciliation of average common shareholders’ equity to average tangible common shareholders’ equity
Common shareholders’ equity
$212,681
$ 182,288 $ 141,638 $ 133,555 $ 129,773
Common Equivalent Securities
2,900
1,213 – – –
Goodwill
(82,596)
(86,034) (79,827) (69,333) (66,040)
Intangible assets (excluding MSRs)
(10,985)
(12,220) (9,502) (9,566) (10,324)
Related deferred tax liabilities
3,306
3,831 1,782 1,845 1,809
Tangible common shareholders’ equity
$125,306
$ 89,078 $ 54,091 $ 56,501 $ 55,218
Reconciliation of average shareholders’ equity to average tangible shareholders’ equity
Shareholders’ equity
$233,231
$ 244,645 $ 164,831 $ 136,662 $ 130,463
Goodwill
(82,596)
(86,034) (79,827) (69,333) (66,040)
Intangible assets (excluding MSRs)
(10,985)
(12,220) (9,502) (9,566) (10,324)
Related deferred tax liabilities
3,306
3,831 1,782 1,845 1,809
Tangible shareholders’ equity
$142,956
$ 150,222 $ 77,284 $ 59,608 $ 55,908
Reconciliation of year end common shareholders’ equity to year end tangible common shareholders’
equity
Common shareholders’ equity
$211,686
$ 194,236 $ 139,351 $ 142,394 $ 132,421
Common Equivalent Securities
–
19,244 – – –
Goodwill
(73,861)
(86,314) (81,934) (77,530) (65,662)
Intangible assets (excluding MSRs)
(9,923)
(12,026) (8,535) (10,296) (9,422)
Related deferred tax liabilities
3,036
3,498 1,854 1,855 1,799
Tangible common shareholders’ equity
$130,938
$ 118,638 $ 50,736 $ 56,423 $ 59,136
Reconciliation of year end shareholders’ equity to year end tangible shareholders’ equity
Shareholders’ equity
$228,248
$ 231,444 $ 177,052 $ 146,803 $ 135,272
Goodwill
(73,861)
(86,314) (81,934) (77,530) (65,662)
Intangible assets (excluding MSRs)
(9,923)
(12,026) (8,535) (10,296) (9,422)
Related deferred tax liabilities
3,036
3,498 1,854 1,855 1,799
Tangible shareholders’ equity
$147,500
$ 136,602 $ 88,437 $ 60,832 $ 61,987
Reconciliation of year end assets to year end tangible assets
Assets
$ 2,264,909
$2,230,232 $1,817,943 $1,715,746 $1,459,737
Goodwill
(73,861)
(86,314) (81,934) (77,530) (65,662)
Intangible assets (excluding MSRs)
(9,923)
(12,026) (8,535) (10,296) (9,422)
Related deferred tax liabilities
3,036
3,498 1,854 1,855 1,799
Tangible assets
$ 2,184,161
$2,135,390 $1,729,328 $1,629,775 $1,386,452
Reconciliation of year end common shares outstanding to year end tangible common shares outstanding
Common shares outstanding
10,085,155
8,650,244 5,017,436 4,437,885 4,458,151
Assumed conversion of common equivalent shares
(2)
–
1,286,000 – – –
Tangible common shares outstanding
10,085,155
9,936,244 5,017,436 4,437,885 4,458,151
(1)
Presents reconciliations of non-GAAP measures to GAAP financial measures. We believe the use of these non-GAAP measures provides additional clarity in assessing the results of the Corporation. Other companies may define or
calculate non-GAAP measures differently. For more information on non-GAAP measures and ratios we use in assessing the results of the Corporation, see Supplemental Financial Data beginning on page 40.
(2)
On February 24, 2010, the common equivalent shares converted into common shares.
130 Bank of America 2010