Bank of America 2010 Annual Report Download - page 231
Download and view the complete annual report
Please find page 231 of the 2010 Bank of America annual report below. You can navigate through the pages in the report by either clicking on the pages listed below, or by using the keyword search tool below to find specific information within the annual report.-
 1
1 -
2
-
3
-
4
-
5
-
6
-
7
-
8
-
9
-
10
-
11
-
12
-
13
-
14
-
15
-
16
-
17
-
18
-
19
-
20
-
21
-
22
-
23
-
24
-
25
-
26
-
27
-
28
-
29
-
30
-
31
-
32
-
33
-
34
-
35
-
36
-
37
-
38
-
39
-
40
-
41
-
42
-
43
-
44
-
45
-
46
-
47
-
48
-
49
-
50
-
51
-
52
-
53
-
54
-
55
-
56
-
57
-
58
-
59
-
60
-
61
-
62
-
63
-
64
-
65
-
66
-
67
-
68
-
69
-
70
-
71
-
72
-
73
-
74
-
75
-
76
-
77
-
78
-
79
-
80
-
81
-
82
-
83
-
84
-
85
-
86
-
87
-
88
-
89
-
90
-
91
-
92
-
93
-
94
-
95
-
96
-
97
-
98
-
99
-
100
-
101
-
102
-
103
-
104
-
105
-
106
-
107
-
108
-
109
-
110
-
111
-
112
-
113
-
114
-
115
-
116
-
117
-
118
-
119
-
120
-
121
-
122
-
123
-
124
-
125
-
126
-
127
-
128
-
129
-
130
-
131
-
132
-
133
-
134
-
135
-
136
-
137
-
138
-
139
-
140
-
141
-
142
-
143
-
144
-
145
-
146
-
147
-
148
-
149
-
150
-
151
-
152
-
153
-
154
-
155
-
156
-
157
-
158
-
159
-
160
-
161
-
162
-
163
-
164
-
165
-
166
-
167
-
168
-
169
-
170
-
171
-
172
-
173
-
174
-
175
-
176
-
177
-
178
-
179
-
180
-
181
-
182
-
183
-
184
-
185
-
186
-
187
-
188
-
189
-
190
-
191
-
192
-
193
-
194
-
195
-
196
-
197
-
198
-
199
-
200
-
201
-
202
-
203
-
204
-
205
-
206
-
207
-
208
-
209
-
210
-
211
-
212
-
213
-
214
-
215
-
216
-
217
-
218
-
219
-
220
-
 221
221 -
 222
222 -
 223
223 -
 224
224 -
 225
225 -
 226
226 -
 227
227 -
 228
228 -
 229
229 -
 230
230 -
 231
231 -
 232
232 -
 233
233 -
 234
234 -
 235
235 -
 236
236 -
 237
237 -
 238
238 -
 239
239 -
 240
240 -
 241
241 -
242
-
243
-
244
-
245
-
246
-
247
-
248
-
249
-
250
-
251
-
252
 |
 |

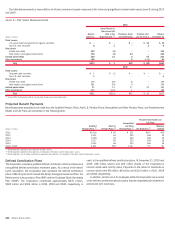
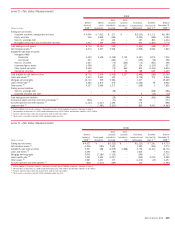
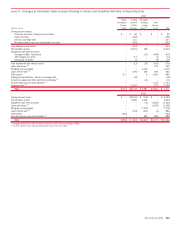
Level 3 – Fair Value Measurements
(Dollars in millions)
Balance
January 1
2009
(1)
Merrill
Lynch
Acquisition
Gains
(Losses)
Included in
Earnings
Gains
(Losses)
Included in
OCI
Purchases,
Issuances and
Settlements
Transfers
into/(out of)
Level 3
(1)
Balance
December 31
2009
(1)
2009
Trading account assets:
Corporate securities, trading loans and other $ 4,540 $ 7,012 $ 370 $ – $(2,015) $ 1,173 $11,080
Equity securities 546 3,848 (396) – (2,425) (489) 1,084
Non-U.S. sovereign debt – 30 136 – 167 810 1,143
Mortgage trading loans and asset-backed securities 1,647 7,294 (262) – 933 (1,842) 7,770
Total trading account assets 6,733 18,184 (152) – (3,340) (348) 21,077
Net derivative assets
(2)
2,270 2,307 5,526 – (7,906) 5,666 7,863
Available-for-sale debt securities:
Non-agency MBS:
Residential 5,439 2,509 (1,159) 2,738 (4,187) 1,876 7,216
Commercial 657 – (185) (7) (155) (52) 258
Non-U.S. securities 1,247 – (79) (226) (73) (401) 468
Corporate/Agency bonds 1,598 – (22) 127 324 (1,100) 927
Other taxable securities 9,599 – (75) 669 815 (1,154) 9,854
Tax-exempt securities 162 – 2 26 788 645 1,623
Total available-for-sale debt securities 18,702 2,509 (1,518) 3,327 (2,488) (186) 20,346
Loans and leases
(3)
5,413 2,452 515 – (3,718) 274 4,936
Mortgage servicing rights 12,733 209 5,286 – 1,237 – 19,465
Loans held-for-sale
(3)
3,382 3,872 678 – (1,048) 58 6,942
Other assets
(4)
4,157 2,696 1,273 – (308) 3 7,821
Trading account liabilities:
Non-U.S. sovereign debt – – (38) – – (348) (386)
Corporate securities and other – – – – 4 (14) (10)
Total trading account liabilities – – (38) – 4 (362) (396)
Commercial paper and other short-term borrowings
(3)
(816) – (11) – 120 – (707)
Accrued expenses and other liabilities
(3)
(1,124) (1,337) 1,396 – 174 – (891)
Long-term debt
(3)
– (7,481) (2,310) – 830 4,301 (4,660)
(1)
Assets (liabilities). For assets, increase / (decrease) to Level 3 and for liabilities, (increase) / decrease to Level 3.
(2)
Net derivatives at December 31, 2009 include derivative assets of $23.0 billion and derivative liabilities of $15.2 billion.
(3)
Amounts represent items which are accounted for under the fair value option.
(4)
Other assets is primarily comprised of AFS marketable equity securities.
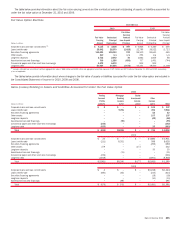
Level 3 – Fair Value Measurements
(Dollars in millions)
Balance
January 1
2008
(1)
Countrywide
Acquisition
Gains
(Losses)
Included in
Earnings
Gains
(Losses)
Included in
OCI
Purchases,
Issuances and
Settlements
Transfers
into/(out of)
Level 3
(1)
Balance
December 31
2008
(1)
2008
Trading account assets $ 4,027 $ – $(3,222) $ – $(1,233) $ 7,161 $ 6,733
Net derivative assets
(2)
(1,203) (185) 2,531 – 1,380 (253) 2,270
Available-for-sale debt securities 5,507 528 (2,509) (1,688) 2,754 14,110 18,702
Loans and leases
(3)
4,590 – (780) – 1,603 – 5,413
Mortgage servicing rights 3,053 17,188 (7,115) – (393) – 12,733
Loans held-for-sale
(3)
1,334 1,425 (1,047) – (542) 2,212 3,382
Other assets
(4)
3,987 1,407 175 – (1,372) (40) 4,157
Accrued expenses and other liabilities
(3)
(660) (1,212) (169) – 101 – (1,940)
(1)
Assets (liabilities). For assets, increase / (decrease) to Level 3 and for liabilities, (increase) / decrease to Level 3.
(2)
Net derivatives at December 31, 2008 include derivative assets of $8.3 billion and derivative liabilities of $6.0 billion.
(3)
Amounts represent items which are accounted for under the fair value option.
(4)
Other assets is primarily comprised of AFS marketable equity securities.
Bank of America 2010 229