Bank of America 2010 Annual Report Download - page 237
Download and view the complete annual report
Please find page 237 of the 2010 Bank of America annual report below. You can navigate through the pages in the report by either clicking on the pages listed below, or by using the keyword search tool below to find specific information within the annual report.-
 1
1 -
2
-
3
-
4
-
5
-
6
-
7
-
8
-
9
-
10
-
11
-
12
-
13
-
14
-
15
-
16
-
17
-
18
-
19
-
20
-
21
-
22
-
23
-
24
-
25
-
26
-
27
-
28
-
29
-
30
-
31
-
32
-
33
-
34
-
35
-
36
-
37
-
38
-
39
-
40
-
41
-
42
-
43
-
44
-
45
-
46
-
47
-
48
-
49
-
50
-
51
-
52
-
53
-
54
-
55
-
56
-
57
-
58
-
59
-
60
-
61
-
62
-
63
-
64
-
65
-
66
-
67
-
68
-
69
-
70
-
71
-
72
-
73
-
74
-
75
-
76
-
77
-
78
-
79
-
80
-
81
-
82
-
83
-
84
-
85
-
86
-
87
-
88
-
89
-
90
-
91
-
92
-
93
-
94
-
95
-
96
-
97
-
98
-
99
-
100
-
101
-
102
-
103
-
104
-
105
-
106
-
107
-
108
-
109
-
110
-
111
-
112
-
113
-
114
-
115
-
116
-
117
-
118
-
119
-
120
-
121
-
122
-
123
-
124
-
125
-
126
-
127
-
128
-
129
-
130
-
131
-
132
-
133
-
134
-
135
-
136
-
137
-
138
-
139
-
140
-
141
-
142
-
143
-
144
-
145
-
146
-
147
-
148
-
149
-
150
-
151
-
152
-
153
-
154
-
155
-
156
-
157
-
158
-
159
-
160
-
161
-
162
-
163
-
164
-
165
-
166
-
167
-
168
-
169
-
170
-
171
-
172
-
173
-
174
-
175
-
176
-
177
-
178
-
179
-
180
-
181
-
182
-
183
-
184
-
185
-
186
-
187
-
188
-
189
-
190
-
191
-
192
-
193
-
194
-
195
-
196
-
197
-
198
-
199
-
200
-
201
-
202
-
203
-
204
-
205
-
206
-
207
-
208
-
209
-
210
-
211
-
212
-
213
-
214
-
215
-
216
-
217
-
218
-
219
-
220
-
221
-
222
-
223
-
224
-
225
-
226
-
 227
227 -
 228
228 -
 229
229 -
 230
230 -
 231
231 -
 232
232 -
 233
233 -
 234
234 -
 235
235 -
 236
236 -
 237
237 -
 238
238 -
 239
239 -
 240
240 -
 241
241 -
 242
242 -
 243
243 -
 244
244 -
 245
245 -
 246
246 -
 247
247 -
248
-
249
-
250
-
251
-
252
 |
 |

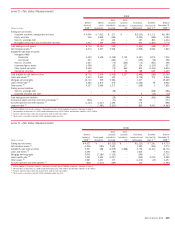
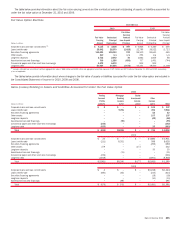
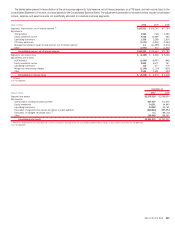
The table below provides information about the fair value carrying amount and the contractual principal outstanding of assets or liabilities accounted for
under the fair value option at December 31, 2010 and 2009.
Fair Value Option Elections
(Dollars in millions)
Fair Value
Carrying
Amount
Contractual
Principal
Outstanding
Fair Value
Carrying
Amount
Less Unpaid
Principal
Fair Value
Carrying
Amount
Contractual
Principal
Outstanding
Fair Value
Carrying
Amount
Less Unpaid
Principal
2010 2009
December 31
Corporate loans and loan commitments
(1)
$ 4,135 $ 3,638 $ 497
$5,865 $5,460 $ 405
Loans held-for-sale
25,942 28,370 (2,428)
32,795 36,522 (3,727)
Securities financing agreements
116,023 115,053 970
95,100 94,641 459
Other assets
310 n/a n/a
253 n/a n/a
Long-term deposits
2,732 2,692 40
1,663 1,605 58
Asset-backed secured financings
706 1,356 (650)
707 1,451 (744)
Commercial paper and other short-term borrowings
6,472 6,472 –
813 813 –
Long-term debt
50,984 54,656 (3,672)
45,451 48,560 (3,109)
(1)
Includes unfunded loan commitments with an aggregate fair value of $866 million and $950 million and aggregated committed exposure of $27.3 billion and $27.0 billion at December 31, 2010 and 2009, respectively.
n/a = not applicable
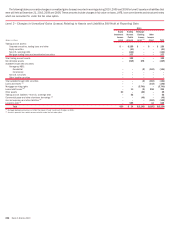
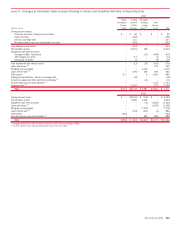
The tables below provide information about where changes in the fair value of assets or liabilities accounted for under the fair value option are included in
the Consolidated Statement of Income for 2010, 2009 and 2008.
Gains (Losses) Relating to Assets and Liabilities Accounted for Under the Fair Value Option
(Dollars in millions)
Trading
Account
Profits
(Losses)
Mortgage
Banking
Income
(Loss)
Equity
Investment
Income
(Loss)
Other
Income
(Loss) Total
2010
Corporate loans and loan commitments
$ 2 $ – $ – $ 105 $ 107
Loans held-for-sale
– 9,091 – 493 9,584
Securities financing agreements
–––5252
Other assets
– – – 107 107
Long-term deposits
– – – (48) (48)
Asset-backed secured financings
– (95) – – (95)
Commercial paper and other short-term borrowings
(192) – – – (192)
Long-term debt
(625) – – 22 (603)
Total $ (815) $8,996 $ – $ 731 $ 8,912
2009
Corporate loans and loan commitments $ 25 $ – $ – $ 1,886 $ 1,911
Loans held-for-sale (211) 8,251 – 588 8,628
Securities financing agreements – – – (292) (292)
Other assets 379 – (177) – 202
Long-term deposits –––3535
Asset-backed secured financings – (11) – – (11)
Commercial paper and other short-term borrowings (236) – – – (236)
Long-term debt (3,938) – – (4,900) (8,838)
Total $(3,981) $8,240 $(177) $(2,683) $ 1,399
2008
Corporate loans and loan commitments $ 4 $ – $ – $(1,248) $(1,244)
Loans held-for-sale (680) 281 – (215) (614)
Securities financing agreements – – – (18) (18)
Long-term deposits – – – (10) (10)
Asset-backed secured financings – 295 – – 295
Total $ (676) $ 576 $ – $(1,491) $(1,591)
Bank of America 2010 235