Bank of America 2010 Annual Report Download - page 97
Download and view the complete annual report
Please find page 97 of the 2010 Bank of America annual report below. You can navigate through the pages in the report by either clicking on the pages listed below, or by using the keyword search tool below to find specific information within the annual report.-
 1
1 -
2
-
3
-
4
-
5
-
6
-
7
-
8
-
9
-
10
-
11
-
12
-
13
-
14
-
15
-
16
-
17
-
18
-
19
-
20
-
21
-
22
-
23
-
24
-
25
-
26
-
27
-
28
-
29
-
30
-
31
-
32
-
33
-
34
-
35
-
36
-
37
-
38
-
39
-
40
-
41
-
42
-
43
-
44
-
45
-
46
-
47
-
48
-
49
-
50
-
51
-
52
-
53
-
54
-
55
-
56
-
57
-
58
-
59
-
60
-
61
-
62
-
63
-
64
-
65
-
66
-
67
-
68
-
69
-
70
-
71
-
72
-
73
-
74
-
75
-
76
-
77
-
78
-
79
-
80
-
81
-
82
-
83
-
84
-
85
-
86
-
 87
87 -
 88
88 -
 89
89 -
 90
90 -
 91
91 -
 92
92 -
 93
93 -
 94
94 -
 95
95 -
 96
96 -
 97
97 -
 98
98 -
 99
99 -
 100
100 -
 101
101 -
 102
102 -
 103
103 -
 104
104 -
 105
105 -
 106
106 -
 107
107 -
108
-
109
-
110
-
111
-
112
-
113
-
114
-
115
-
116
-
117
-
118
-
119
-
120
-
121
-
122
-
123
-
124
-
125
-
126
-
127
-
128
-
129
-
130
-
131
-
132
-
133
-
134
-
135
-
136
-
137
-
138
-
139
-
140
-
141
-
142
-
143
-
144
-
145
-
146
-
147
-
148
-
149
-
150
-
151
-
152
-
153
-
154
-
155
-
156
-
157
-
158
-
159
-
160
-
161
-
162
-
163
-
164
-
165
-
166
-
167
-
168
-
169
-
170
-
171
-
172
-
173
-
174
-
175
-
176
-
177
-
178
-
179
-
180
-
181
-
182
-
183
-
184
-
185
-
186
-
187
-
188
-
189
-
190
-
191
-
192
-
193
-
194
-
195
-
196
-
197
-
198
-
199
-
200
-
201
-
202
-
203
-
204
-
205
-
206
-
207
-
208
-
209
-
210
-
211
-
212
-
213
-
214
-
215
-
216
-
217
-
218
-
219
-
220
-
221
-
222
-
223
-
224
-
225
-
226
-
227
-
228
-
229
-
230
-
231
-
232
-
233
-
234
-
235
-
236
-
237
-
238
-
239
-
240
-
241
-
242
-
243
-
244
-
245
-
246
-
247
-
248
-
249
-
250
-
251
-
252
 |
 |

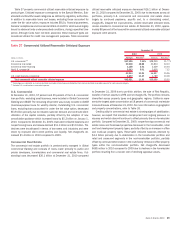
We also have indirect exposure to monolines as we invest in securities
where the issuers have purchased wraps (i.e., insurance). For example,
municipalities and corporations purchase insurance in order to reduce their
cost of borrowing. If the ratings agencies downgrade the monolines, the credit
rating of the bond may fall and may have an adverse impact on the market
value of the security. In the case of default, we first look to the underlying
securities and then to recovery on the purchased insurance. Investments in
securities issued by municipalities and corporations with purchased wraps at
December 31, 2010 and 2009 had a notional value of $2.4 billion and
$5.0 billion. Mark-to-market investment exposure was $2.2 billion at Decem-
ber 31, 2010 compared to $4.9 billion at December 31, 2009.
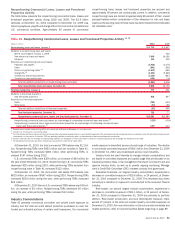
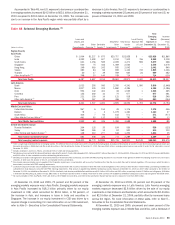
Table 42 Commercial Credit Exposure by Industry
(1)
(Dollars in millions)
2010 2009 2010 2009
Commercial Utilized
Total Commercial
Committed
December 31
Diversified financials
$55,196
$69,259
$83,248
$109,079
Real estate
(2)
58,531
75,049
72,004
93,147
Government and public education
44,131
44,151
59,594
61,998
Healthcare equipment and services
30,420
29,584
47,569
46,870
Capital goods
21,940
23,911
46,087
48,184
Retailing
24,660
23,671
43,950
42,414
Consumer services
24,759
28,704
39,694
44,214
Materials
15,873
16,373
33,046
33,233
Commercial services and supplies
20,056
23,892
30,517
34,646
Banks
26,831
20,299
29,667
23,384
Food, beverage and tobacco
14,777
14,812
28,126
28,079
Energy
9,765
9,605
26,328
23,619
Insurance, including monolines
17,263
20,613
24,417
28,033
Utilities
6,990
9,217
24,207
25,316
Individuals and trusts
18,278
25,941
22,899
34,698
Media
11,611
14,020
20,619
22,886
Transpor tation
12,070
13,724
18,436
20,101
Pharmaceuticals and biotechnology
3,859
2,875
11,009
10,626
Technology hardware and equipment
4,373
3,416
10,932
10,516
Religious and social organizations
8,409
8,920
10,823
11,374
Software and services
3,837
3,216
9,531
9,359
Telecommunication services
3,823
3,558
9,321
9,478
Consumer durables and apparel
4,297
4,409
8,836
9,998
Food and staples retailing
3,222
3,680
6,161
6,562
Automobiles and components
2,090
2,379
5,941
6,359
Other
13,361
10,219
17,133
14,013
Total commercial credit exposure by industry
$460,422
$505,497
$740,095
$808,186
Net credit default protection purchased on total commitments
(3)
$ (20,118)
$(19,025)
(1)
Includes U.S. small business commercial exposure.
(2)
Industries are viewed from a variety of perspectives to best isolate the perceived risks. For purposes of this table, the real estate industry is defined based on the borrowers’ or counterparties’ primary business activityusing operating
cash flows and primary source of repayment as key factors.
(3)
Represents net notional credit protection purchased. See Risk Mitigation below for additional information.
Risk Mitigation
We purchase credit protection to cover the funded portion as well as the
unfunded portion of certain credit exposures. To lower the cost of obtaining
our desired credit protection levels, credit exposure may be added within an
industry, borrower or counterparty group by selling protection.
At December 31, 2010 and 2009, net notional credit default protection
purchased in our credit derivatives portfolio to hedge our funded and un-
funded exposures for which we elected the fair value option, as well as certain
other credit exposures, was $20.1 billion and $19.0 billion. The mark-to-mar-
ket effects, including the cost of net credit default protection hedging our
credit exposure, resulted in net losses of $546 million during 2010 compared
to net losses of $2.9 billion in 2009. The average Value-at-Risk (VaR) for these
credit derivative hedges was $53 million for 2010 compared to $76 million for
2009. The average VaR for the related credit exposure was $65 million in
2010 compared to $130 million in 2009. There is a diversification effect
between the net credit default protection hedging our credit exposure and the
related credit exposure such that the combined average VaR was $41 million
for 2010, compared to $89 million for 2009. Refer to Trading Risk Manage-
ment beginning on page 104 for a description of our VaR calculation for the
market-based trading portfolio.
Bank of America 2010 95