Bank of America 2010 Annual Report Download - page 234
Download and view the complete annual report
Please find page 234 of the 2010 Bank of America annual report below. You can navigate through the pages in the report by either clicking on the pages listed below, or by using the keyword search tool below to find specific information within the annual report.-
 1
1 -
2
-
3
-
4
-
5
-
6
-
7
-
8
-
9
-
10
-
11
-
12
-
13
-
14
-
15
-
16
-
17
-
18
-
19
-
20
-
21
-
22
-
23
-
24
-
25
-
26
-
27
-
28
-
29
-
30
-
31
-
32
-
33
-
34
-
35
-
36
-
37
-
38
-
39
-
40
-
41
-
42
-
43
-
44
-
45
-
46
-
47
-
48
-
49
-
50
-
51
-
52
-
53
-
54
-
55
-
56
-
57
-
58
-
59
-
60
-
61
-
62
-
63
-
64
-
65
-
66
-
67
-
68
-
69
-
70
-
71
-
72
-
73
-
74
-
75
-
76
-
77
-
78
-
79
-
80
-
81
-
82
-
83
-
84
-
85
-
86
-
87
-
88
-
89
-
90
-
91
-
92
-
93
-
94
-
95
-
96
-
97
-
98
-
99
-
100
-
101
-
102
-
103
-
104
-
105
-
106
-
107
-
108
-
109
-
110
-
111
-
112
-
113
-
114
-
115
-
116
-
117
-
118
-
119
-
120
-
121
-
122
-
123
-
124
-
125
-
126
-
127
-
128
-
129
-
130
-
131
-
132
-
133
-
134
-
135
-
136
-
137
-
138
-
139
-
140
-
141
-
142
-
143
-
144
-
145
-
146
-
147
-
148
-
149
-
150
-
151
-
152
-
153
-
154
-
155
-
156
-
157
-
158
-
159
-
160
-
161
-
162
-
163
-
164
-
165
-
166
-
167
-
168
-
169
-
170
-
171
-
172
-
173
-
174
-
175
-
176
-
177
-
178
-
179
-
180
-
181
-
182
-
183
-
184
-
185
-
186
-
187
-
188
-
189
-
190
-
191
-
192
-
193
-
194
-
195
-
196
-
197
-
198
-
199
-
200
-
201
-
202
-
203
-
204
-
205
-
206
-
207
-
208
-
209
-
210
-
211
-
212
-
213
-
214
-
215
-
216
-
217
-
218
-
219
-
220
-
221
-
222
-
223
-
 224
224 -
 225
225 -
 226
226 -
 227
227 -
 228
228 -
 229
229 -
 230
230 -
 231
231 -
 232
232 -
 233
233 -
 234
234 -
 235
235 -
 236
236 -
 237
237 -
 238
238 -
 239
239 -
 240
240 -
 241
241 -
 242
242 -
 243
243 -
 244
244 -
245
-
246
-
247
-
248
-
249
-
250
-
251
-
252
 |
 |

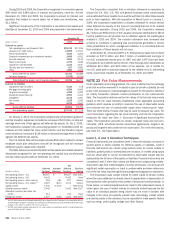
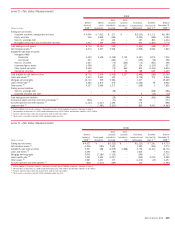
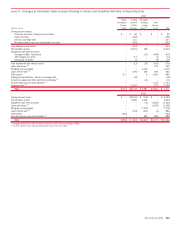
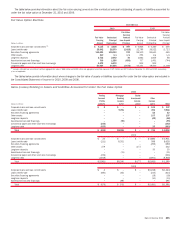
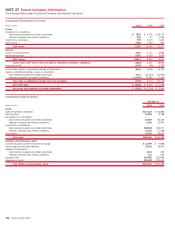
The following tables summarize changes in unrealized gains (losses) recorded in earnings during 2010, 2009 and 2008 for Level 3 assets and liabilitiesthat
were still held at December 31, 2010, 2009 and 2008. These amounts include changes in fair value on loans, LHFS, loan commitments and structured notes
which are accounted for under the fair value option.
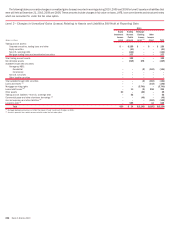
Level 3 – Changes in Unrealized Gains (Losses) Relating to Assets and Liabilities Still Held at Reporting Date
(Dollars in millions)
Equity
Investment
Income
(Loss)
Trading
Account
Profits
(Losses)
Mortgage
Banking
Income
(Loss)
(1)
Other
Income
(Loss) Total
2010
Trading account assets:
Corporate securities, trading loans and other
$ – $ 289 $ – $ – $ 289
Equity securities
– (50) – – (50)
Non-U.S. sovereign debt
– (144) – – (144)
Mortgage trading loans and asset-backed securities
– 227 – – 227
Total trading account assets
– 322 – – 322
Net derivative assets
– (945) 676 – (269)
Available-for-sale debt securities:
Non-agency MBS:
Residential
– – (2) (162) (164)
Commercial
–– –– –
Non-U.S. securities
–– –– –
Other taxable securities
–– –– –
Total available-for-sale debt securities
– – (2) (162) (164)
Loans and leases
(2)
– – – (142) (142)
Mortgage servicing rights
– – (5,740) – (5,740)
Loans held-for-sale
(2)
– 10 (9) 258 259
Other assets
50 – (22) – 28
Trading account liabilities – Non-U.S. sovereign debt
–52 – – 52
Commercial paper and other short-term borrowings
(2)
– – (46) – (46)
Accrued expenses and other liabilities
(2)
– – – (182) (182)
Long-term debt
(2)
– 585 – 43 628
Total
$50 $ 24 $(5,143) $(185) $(5,254)
(1)
Mortgage banking income does not reflect the impact of Level 1 and Level 2 hedges on MSRs.
(2)
Amounts represent items which are accounted for under the fair value option.
232 Bank of America 2010