Bank of America 2010 Annual Report Download - page 56
Download and view the complete annual report
Please find page 56 of the 2010 Bank of America annual report below. You can navigate through the pages in the report by either clicking on the pages listed below, or by using the keyword search tool below to find specific information within the annual report.-
 1
1 -
2
-
3
-
4
-
5
-
6
-
7
-
8
-
9
-
10
-
11
-
12
-
13
-
14
-
15
-
16
-
17
-
18
-
19
-
20
-
21
-
22
-
23
-
24
-
25
-
26
-
27
-
28
-
29
-
30
-
31
-
32
-
33
-
34
-
35
-
36
-
37
-
38
-
39
-
40
-
41
-
42
-
43
-
44
-
45
-
 46
46 -
 47
47 -
 48
48 -
 49
49 -
 50
50 -
 51
51 -
 52
52 -
 53
53 -
 54
54 -
 55
55 -
 56
56 -
 57
57 -
 58
58 -
 59
59 -
 60
60 -
 61
61 -
 62
62 -
 63
63 -
 64
64 -
 65
65 -
 66
66 -
67
-
68
-
69
-
70
-
71
-
72
-
73
-
74
-
75
-
76
-
77
-
78
-
79
-
80
-
81
-
82
-
83
-
84
-
85
-
86
-
87
-
88
-
89
-
90
-
91
-
92
-
93
-
94
-
95
-
96
-
97
-
98
-
99
-
100
-
101
-
102
-
103
-
104
-
105
-
106
-
107
-
108
-
109
-
110
-
111
-
112
-
113
-
114
-
115
-
116
-
117
-
118
-
119
-
120
-
121
-
122
-
123
-
124
-
125
-
126
-
127
-
128
-
129
-
130
-
131
-
132
-
133
-
134
-
135
-
136
-
137
-
138
-
139
-
140
-
141
-
142
-
143
-
144
-
145
-
146
-
147
-
148
-
149
-
150
-
151
-
152
-
153
-
154
-
155
-
156
-
157
-
158
-
159
-
160
-
161
-
162
-
163
-
164
-
165
-
166
-
167
-
168
-
169
-
170
-
171
-
172
-
173
-
174
-
175
-
176
-
177
-
178
-
179
-
180
-
181
-
182
-
183
-
184
-
185
-
186
-
187
-
188
-
189
-
190
-
191
-
192
-
193
-
194
-
195
-
196
-
197
-
198
-
199
-
200
-
201
-
202
-
203
-
204
-
205
-
206
-
207
-
208
-
209
-
210
-
211
-
212
-
213
-
214
-
215
-
216
-
217
-
218
-
219
-
220
-
221
-
222
-
223
-
224
-
225
-
226
-
227
-
228
-
229
-
230
-
231
-
232
-
233
-
234
-
235
-
236
-
237
-
238
-
239
-
240
-
241
-
242
-
243
-
244
-
245
-
246
-
247
-
248
-
249
-
250
-
251
-
252
 |
 |

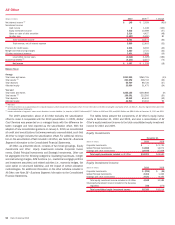
All Other
(Dollars in millions)
2010 2009
(2)
% Change
Net interest income
(1)
$148
$ 2,029 (93)%
Noninterest income:
Card income
2
1,138 (100)
Equity investment income
4,532
10,589 (57)
Gains on sales of debt securities
2,314
4,437 (48)
All other loss
(1,127)
(5,590) 80
Total noninterest income
5,721
10,574 (46)
Total revenue, net of interest expense
5,869
12,603 (53)
Provision for credit losses
4,634
8,002 (42)
Merger and restructuring charges
1,820
2,721 (33)
All other noninterest expense
2,431
2,909 (16)
Loss before income taxes
(3,016)
(1,029) (193)
Income tax benefit
(1)
(4,103)
(2,357) (74)
Net income
$1,087
$ 1,328 (18)
Balance Sheet
Average
Total loans and leases
$250,956
$260,755 (4)%
Total assets
(3)
263,592
338,703 (22)
Total dep osits
55,769
88,736 (37)
Allocated equity
33,964
51,475 (34)
Year end
Total loans and leases
$255,155
$250,868 2%
Total assets
(3)
186,391
233,293 (20)
Total dep osits
38,162
65,434 (42)
Allocated equity
44,933
23,303 92
(1)
FTE basis
(2)
2009 is presented on an as adjusted basis for comparative purposes, which excludes the securitization offset. For more information on All Other, including the securitization offset, see Note 26 – Business Segment Information to the
Consolidated Financial Statements.
(3)
Includes elimination of segments’ excess asset allocations to match liabilities (i.e., deposits) of $621.3 billion and $537.1 billion for 2010 and 2009, and $645.8 billion and $586.0 billion at December 31, 2010 and 2009.
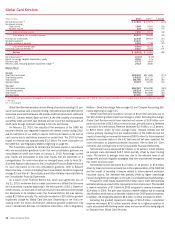
The 2009 presentation above of All Other excludes the securitization
offset to make it comparable with the 2010 presentation. In 2009, Global
Card Services was presented on a managed basis with the difference be-
tween managed and held reported as the securitization offset. With the
adoption of new consolidation guidance on January 1, 2010, we consolidated
all credit card securitizations that were previously unconsolidated, such that
All Other no longer includes the securitization offset. For additional informa-
tion on the securitization offset included in All Other,seeNote 26 – Business
Segment Information to the Consolidated Financial Statements.
All Other, as presented above, consists of two broad groupings, Equity
Investments and Other. Equity Investments includes Corporate Invest-
ments, Global Principal Investments and Strategic Investments. Other can
be segregated into the following categories: liquidating businesses, merger
and restructuring charges, ALM functions (i.e., residential mortgage portfolio
and investment securities) and related activities (i.e., economic hedges, fair
value option on structured liabilities), and the impact of certain allocation
methodologies. For additional information on the other activities included in
All Other,seeNote 26 – Business Segment Information to the Consolidated
Financial Statements.
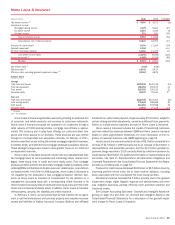
The tables below present the components of All Other’s equity invest-
ments at December 31, 2010 and 2009, and also a reconciliation of All
Other’s equity investment income to the total consolidated equity investment
income for 2010 and 2009.
Equity Investments
(Dollars in millions)
2010 2009
December 31
Corporate Investments
$–
$2,731
Global Principal Investments
11,656
14,071
Strategic and other investments
22,545
27,838
Total equity investments included in All Other
$34,201
$44,640
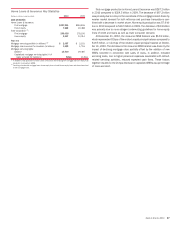
Equity Investment Income
(Dollars in millions)
2010 2009
Corporate Investments
$ (293)
$(88)
Global Principal Investments
2,304
1,222
Strategic and other investments
2,521
9,455
Total equity investment income included in All Other
4,532
10,589
Total equity investment income included in the business
segments
728
(575)
Total consolidated equity investment income
$5,260
$10,014
54 Bank of America 2010