Bank of America 2010 Annual Report Download - page 133
Download and view the complete annual report
Please find page 133 of the 2010 Bank of America annual report below. You can navigate through the pages in the report by either clicking on the pages listed below, or by using the keyword search tool below to find specific information within the annual report.-
 1
1 -
2
-
3
-
4
-
5
-
6
-
7
-
8
-
9
-
10
-
11
-
12
-
13
-
14
-
15
-
16
-
17
-
18
-
19
-
20
-
21
-
22
-
23
-
24
-
25
-
26
-
27
-
28
-
29
-
30
-
31
-
32
-
33
-
34
-
35
-
36
-
37
-
38
-
39
-
40
-
41
-
42
-
43
-
44
-
45
-
46
-
47
-
48
-
49
-
50
-
51
-
52
-
53
-
54
-
55
-
56
-
57
-
58
-
59
-
60
-
61
-
62
-
63
-
64
-
65
-
66
-
67
-
68
-
69
-
70
-
71
-
72
-
73
-
74
-
75
-
76
-
77
-
78
-
79
-
80
-
81
-
82
-
83
-
84
-
85
-
86
-
87
-
88
-
89
-
90
-
91
-
92
-
93
-
94
-
95
-
96
-
97
-
98
-
99
-
100
-
101
-
102
-
103
-
104
-
105
-
106
-
107
-
108
-
109
-
110
-
111
-
112
-
113
-
114
-
115
-
116
-
117
-
118
-
119
-
120
-
121
-
122
-
 123
123 -
 124
124 -
 125
125 -
 126
126 -
 127
127 -
 128
128 -
 129
129 -
 130
130 -
 131
131 -
 132
132 -
 133
133 -
 134
134 -
 135
135 -
 136
136 -
 137
137 -
 138
138 -
 139
139 -
 140
140 -
 141
141 -
 142
142 -
 143
143 -
144
-
145
-
146
-
147
-
148
-
149
-
150
-
151
-
152
-
153
-
154
-
155
-
156
-
157
-
158
-
159
-
160
-
161
-
162
-
163
-
164
-
165
-
166
-
167
-
168
-
169
-
170
-
171
-
172
-
173
-
174
-
175
-
176
-
177
-
178
-
179
-
180
-
181
-
182
-
183
-
184
-
185
-
186
-
187
-
188
-
189
-
190
-
191
-
192
-
193
-
194
-
195
-
196
-
197
-
198
-
199
-
200
-
201
-
202
-
203
-
204
-
205
-
206
-
207
-
208
-
209
-
210
-
211
-
212
-
213
-
214
-
215
-
216
-
217
-
218
-
219
-
220
-
221
-
222
-
223
-
224
-
225
-
226
-
227
-
228
-
229
-
230
-
231
-
232
-
233
-
234
-
235
-
236
-
237
-
238
-
239
-
240
-
241
-
242
-
243
-
244
-
245
-
246
-
247
-
248
-
249
-
250
-
251
-
252
 |
 |

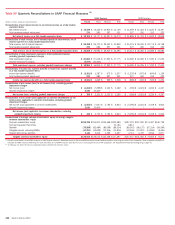
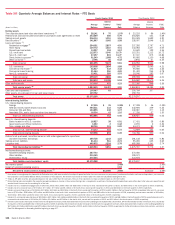
Table XIV Quarterly Supplemental Financial Data
(1)
(Dollars in millions, except per share information)
Fourth Third Second First Fourth Third Second First
2010 Quarters 2009 Quarters
Fully taxable-equivalent basis data
Net interest income
$12,709
$12,717 $13,197 $14,070 $11,896 $11,753 $11,942 $12,819
Total revenue, net of interest expense
22,668
26,982 29,450 32,290 25,413 26,365 33,086 36,080
Net interest yield
(2)
2.69%
2.72% 2.77% 2.93% 2.62% 2.61% 2.64% 2.70%
Efficiency ratio
92.04
100.87 58.58 55.05 64.47 61.84 51.44 47.12
Performance ratios, excluding goodwill impairment charges
(3)
Per common share information
Earnings
$0.04
$0.27
Diluted earnings
0.04
0.27
Efficiency ratio
83.22%
62.33%
Return on average assets
0.13
0.52
Four quarter trailing return on average assets
(4)
0.43
0.39
Return on average common shareholders’ equity
0.79
5.06
Return on average tangible common shareholders’ equity
1.27
8.67
Return on average tangible shareholders’ equity
1.96
8.54
(1)
Supplemental financial data on a FTE basis and performance measures and ratios excluding the impact of goodwill impairment charges are non-GAAP measures. Other companies may define or calculate these measures differently.
For additional information on these performance measures and ratios, see Supplemental Financial Data beginning on page 40 and for corresponding reconciliations to GAAP financial measures, see Table XV.
(2)
Calculation includes fees earned on overnight deposits placed with the Federal Reserve of $63 million, $107 million, $106 million and $92 million for the fourth, third, second and first quarters of 2010, and $130 million,
$107 million, $92 million and $50 million for the fourth, third, second and first quarters of 2009, respectively.
(3)
Performance ratios are calculated excluding the impact of the goodwill impairment charges of $10.4 billion recorded during the third quarter of 2010 and $2.0 billion recorded during the fourth quarter of 2010.
(4)
Calculated as total net income for four consecutive quarters divided by average assets for the period.
Bank of America 2010 131