Bank of America 2010 Annual Report Download - page 244
Download and view the complete annual report
Please find page 244 of the 2010 Bank of America annual report below. You can navigate through the pages in the report by either clicking on the pages listed below, or by using the keyword search tool below to find specific information within the annual report.-
 1
1 -
2
-
3
-
4
-
5
-
6
-
7
-
8
-
9
-
10
-
11
-
12
-
13
-
14
-
15
-
16
-
17
-
18
-
19
-
20
-
21
-
22
-
23
-
24
-
25
-
26
-
27
-
28
-
29
-
30
-
31
-
32
-
33
-
34
-
35
-
36
-
37
-
38
-
39
-
40
-
41
-
42
-
43
-
44
-
45
-
46
-
47
-
48
-
49
-
50
-
51
-
52
-
53
-
54
-
55
-
56
-
57
-
58
-
59
-
60
-
61
-
62
-
63
-
64
-
65
-
66
-
67
-
68
-
69
-
70
-
71
-
72
-
73
-
74
-
75
-
76
-
77
-
78
-
79
-
80
-
81
-
82
-
83
-
84
-
85
-
86
-
87
-
88
-
89
-
90
-
91
-
92
-
93
-
94
-
95
-
96
-
97
-
98
-
99
-
100
-
101
-
102
-
103
-
104
-
105
-
106
-
107
-
108
-
109
-
110
-
111
-
112
-
113
-
114
-
115
-
116
-
117
-
118
-
119
-
120
-
121
-
122
-
123
-
124
-
125
-
126
-
127
-
128
-
129
-
130
-
131
-
132
-
133
-
134
-
135
-
136
-
137
-
138
-
139
-
140
-
141
-
142
-
143
-
144
-
145
-
146
-
147
-
148
-
149
-
150
-
151
-
152
-
153
-
154
-
155
-
156
-
157
-
158
-
159
-
160
-
161
-
162
-
163
-
164
-
165
-
166
-
167
-
168
-
169
-
170
-
171
-
172
-
173
-
174
-
175
-
176
-
177
-
178
-
179
-
180
-
181
-
182
-
183
-
184
-
185
-
186
-
187
-
188
-
189
-
190
-
191
-
192
-
193
-
194
-
195
-
196
-
197
-
198
-
199
-
200
-
201
-
202
-
203
-
204
-
205
-
206
-
207
-
208
-
209
-
210
-
211
-
212
-
213
-
214
-
215
-
216
-
217
-
218
-
219
-
220
-
221
-
222
-
223
-
224
-
225
-
226
-
227
-
228
-
229
-
230
-
231
-
232
-
233
-
 234
234 -
 235
235 -
 236
236 -
 237
237 -
 238
238 -
 239
239 -
 240
240 -
 241
241 -
 242
242 -
 243
243 -
 244
244 -
 245
245 -
 246
246 -
 247
247 -
 248
248 -
 249
249 -
 250
250 -
 251
251 -
 252
252
 |
 |

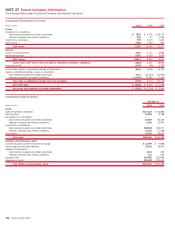
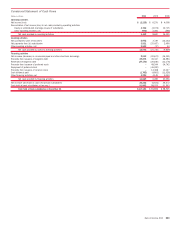
NOTE 27 Parent Company Information
The following tables present the Parent Company only financial information.
Condensed Statement of Income
(Dollars in millions)
2010 2009 2008
Income
Dividends from subsidiaries:
Bank holding companies and related subsidiaries
$7,263
$ 4,100 $ 18,178
Nonbank companies and related subsidiaries
226
27 1,026
Interest from subsidiaries
999
1,179 3,433
Other income
2,781
7,784 940
Total income
11,269
13,090 23,577
Expense
Interest on borrowed funds
4,484
4,737 6,818
Noninterest expense
8,030
4,238 1,829
Total expense
12,514
8,975 8,647
Income (loss) before income taxes and equity in undistributed earnings of subsidiaries
(1,245)
4,115 14,930
Income tax benefit
(3,709)
(85) (1,793)
Income before equity in undistributed earnings of subsidiaries
2,464
4,200 16,723
Equity in undistributed earnings (losses) of subsidiaries:
Bank holding companies and related subsidiaries
7,647
(21,614) (10,559)
Nonbank companies and related subsidiaries
(12,349)
23,690 (2,156)
Total equity in undistributed earnings (losses) of subsidiaries
(4,702)
2,076 (12,715)
Net income (loss)
$(2,238)
$6,276 $4,008
Net income (loss) applicable to common shareholders
$(3,595)
$ (2,204) $ 2,556
Condensed Balance Sheet
(Dollars in millions)
2010 2009
December 31
Assets
Cash held at bank subsidiaries
$117,124
$91,892
Debt securities
19,518
8,788
Receivables from subsidiaries:
Bank holding companies and related subsidiaries
50,589
54,442
Nonbank companies and related subsidiaries
8,320
13,043
Investments in subsidiaries:
Bank holding companies and related subsidiaries
188,538
186,673
Nonbank companies and related subsidiaries
61,374
67,399
Other assets
10,837
18,262
Total assets
$456,300
$440,499
Liabilities and shareholders’ equity
Commercial paper and other short-term borrowings
$13,899
$5,968
Accrued expenses and other liabilities
22,803
19,204
Payables to subsidiaries:
Bank holding companies and related subsidiaries
4,241
363
Nonbank companies and related subsidiaries
513
632
Long-term debt
186,596
182,888
Shareholders’ equity
228,248
231,444
Total liabilities and shareholders’ equity
$456,300
$440,499
242 Bank of America 2010