Bank of America 2010 Annual Report Download - page 169
Download and view the complete annual report
Please find page 169 of the 2010 Bank of America annual report below. You can navigate through the pages in the report by either clicking on the pages listed below, or by using the keyword search tool below to find specific information within the annual report.-
 1
1 -
2
-
3
-
4
-
5
-
6
-
7
-
8
-
9
-
10
-
11
-
12
-
13
-
14
-
15
-
16
-
17
-
18
-
19
-
20
-
21
-
22
-
23
-
24
-
25
-
26
-
27
-
28
-
29
-
30
-
31
-
32
-
33
-
34
-
35
-
36
-
37
-
38
-
39
-
40
-
41
-
42
-
43
-
44
-
45
-
46
-
47
-
48
-
49
-
50
-
51
-
52
-
53
-
54
-
55
-
56
-
57
-
58
-
59
-
60
-
61
-
62
-
63
-
64
-
65
-
66
-
67
-
68
-
69
-
70
-
71
-
72
-
73
-
74
-
75
-
76
-
77
-
78
-
79
-
80
-
81
-
82
-
83
-
84
-
85
-
86
-
87
-
88
-
89
-
90
-
91
-
92
-
93
-
94
-
95
-
96
-
97
-
98
-
99
-
100
-
101
-
102
-
103
-
104
-
105
-
106
-
107
-
108
-
109
-
110
-
111
-
112
-
113
-
114
-
115
-
116
-
117
-
118
-
119
-
120
-
121
-
122
-
123
-
124
-
125
-
126
-
127
-
128
-
129
-
130
-
131
-
132
-
133
-
134
-
135
-
136
-
137
-
138
-
139
-
140
-
141
-
142
-
143
-
144
-
145
-
146
-
147
-
148
-
149
-
150
-
151
-
152
-
153
-
154
-
155
-
156
-
157
-
158
-
 159
159 -
 160
160 -
 161
161 -
 162
162 -
 163
163 -
 164
164 -
 165
165 -
 166
166 -
 167
167 -
 168
168 -
 169
169 -
 170
170 -
 171
171 -
 172
172 -
 173
173 -
 174
174 -
 175
175 -
 176
176 -
 177
177 -
 178
178 -
 179
179 -
180
-
181
-
182
-
183
-
184
-
185
-
186
-
187
-
188
-
189
-
190
-
191
-
192
-
193
-
194
-
195
-
196
-
197
-
198
-
199
-
200
-
201
-
202
-
203
-
204
-
205
-
206
-
207
-
208
-
209
-
210
-
211
-
212
-
213
-
214
-
215
-
216
-
217
-
218
-
219
-
220
-
221
-
222
-
223
-
224
-
225
-
226
-
227
-
228
-
229
-
230
-
231
-
232
-
233
-
234
-
235
-
236
-
237
-
238
-
239
-
240
-
241
-
242
-
243
-
244
-
245
-
246
-
247
-
248
-
249
-
250
-
251
-
252
 |
 |

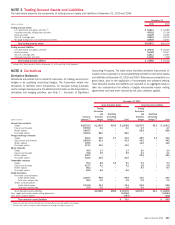
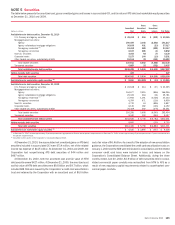
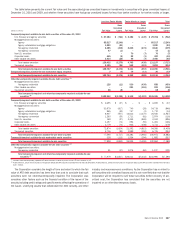
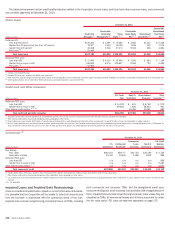
The table below presents the current fair value and the associated gross unrealized losses on investments in securities with gross unrealized losses at
December 31, 2010 and 2009, and whether these securities have had gross unrealized losses for less than twelve months or for twelve months or longer.
(Dollars in millions)
Fair Value
Gross
Unrealized
Losses Fair Value
Gross
Unrealized
Losses Fair Value
Gross
Unrealized
Losses
Less than Twelve Months Twelve Months or Longer Total
Temporarily-impaired available-for-sale debt securities at December 31, 2010
U.S. Treasury and agency securities
$ 27,384 $ (763) $ 2,382 $ (149) $ 29,766 $ (912)
Mortgage-backed securities:
Agency
85,517 (2,240) – – 85,517 (2,240)
Agency collateralized mortgage obligations
3,220 (23) – – 3,220 (23)
Non-agency residential
6,385 (205) 2,245 (274) 8,630 (479)
Non-agency commercial
47 (1) – – 47 (1)
Non-U.S. securities
– – 70 (7) 70 (7)
Corporate bonds
465 (9) 22 (1) 487 (10)
Other taxable securities
3,414 (38) 46 (7) 3,460 (45)
Total taxable securities
126,432 (3,279) 4,765 (438) 131,197 (3,717)
Tax-exempt securities
2,325 (95) 568 (119) 2,893 (214)
Total temporarily-impaired available-for-sale debt securities 128,757 (3,374) 5,333 (557) 134,090 (3,931)
Temporarily-impaired available-for-sale marketable equity securities 7 (2) 19 (11) 26 (13)
Total temporarily-impaired available-for-sale securities 128,764 (3,376) 5,352 (568) 134,116 (3,944)
Other-than-temporarily impaired available-for-sale debt securities
(1)
Mortgage-backed securities:
Non-agency residential
128 (11) 530 (439) 658 (450)
Other taxable securities
– – 223 (116) 223 (116)
Tax-exempt securities
68 (8) – – 68 (8)
Total temporarily-impaired and other-than-temporarily impaired available-for-sale
securities
(2)
$128,960 $(3,395) $ 6,105 $(1,123) $135,065 $(4,518)
Temporarily-impaired available-for-sale debt securities at December 31, 2009
U.S. Treasury and agency securities $ 4,655 $ (37) $ – $ – $ 4,655 $ (37)
Mortgage-backed securities:
Agency 53,979 (817) 740 (29) 54,719 (846)
Agency collateralized mortgage obligations 965 (10) 747 (3) 1,712 (13)
Non-agency residential 6,907 (557) 13,613 (3,370) 20,520 (3,927)
Non-agency commercial 1,263 (35) 1,711 (81) 2,974 (116)
Non-U.S. securities 169 (27) 3,355 (869) 3,524 (896)
Corporate bonds 1,157 (71) 294 (55) 1,451 (126)
Other taxable securities 3,779 (70) 932 (408) 4,711 (478)
Total taxable securities 72,874 (1,624) 21,392 (4,815) 94,266 (6,439)
Tax-exempt securities 4,716 (93) 1,989 (150) 6,705 (243)
Total temporarily-impaired available-for-sale debt securities
77,590 (1,717) 23,381 (4,965) 100,971 (6,682)
Temporarily-impaired available-for-sale marketable equity securities
338 (113) 1,554 (394) 1,892 (507)
Total temporarily-impaired available-for-sale securities
77,928 (1,830) 24,935 (5,359) 102,863 (7,189)
Other-than-temporarily impaired available-for-sale debt securities
(1)
Mortgage-backed securities:
Non-agency residential 51 (17) 1,076 (84) 1,127 (101)
Total temporarily-impaired and other-than-temporarily impaired available-for-sale
securities
(2)
$ 77,979 $(1,847) $26,011 $(5,443) $103,990 $(7,290)
(1)
Includes other-than-temporarily impaired AFS debt securities on which a portion of the OTTI loss remains in OCI.
(2)
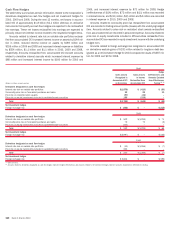
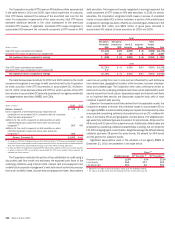
At December 31, 2010, the amortized cost of approximately 8,500 AFS securities exceeded their fair value by$4.5 billion. At December 31, 2009, the amortized cost of approximately 12,000 AFS securities exceeded their fair value
by $7.3 billion.
The Corporation considers the length of time and extent to which the fair
value of AFS debt securities has been less than cost to conclude that such
securities were not other-than-temporarily impaired. The Corporation also
considers other factors such as the financial condition of the issuer of the
security including credit ratings and specific events affecting the operations of
the issuer, underlying assets that collateralize the debt security, and other
industry and macroeconomic conditions. As the Corporation has no intent to
sell securities with unrealized losses and it is not more-likely-than-not that the
Corporation will be required to sell these securities before recovery of am-
ortized cost, the Corporation has concluded that the securities are not
impaired on an other-than-temporary basis.
Bank of America 2010 167