Bank of America 2010 Annual Report Download - page 214
Download and view the complete annual report
Please find page 214 of the 2010 Bank of America annual report below. You can navigate through the pages in the report by either clicking on the pages listed below, or by using the keyword search tool below to find specific information within the annual report.-
 1
1 -
2
-
3
-
4
-
5
-
6
-
7
-
8
-
9
-
10
-
11
-
12
-
13
-
14
-
15
-
16
-
17
-
18
-
19
-
20
-
21
-
22
-
23
-
24
-
25
-
26
-
27
-
28
-
29
-
30
-
31
-
32
-
33
-
34
-
35
-
36
-
37
-
38
-
39
-
40
-
41
-
42
-
43
-
44
-
45
-
46
-
47
-
48
-
49
-
50
-
51
-
52
-
53
-
54
-
55
-
56
-
57
-
58
-
59
-
60
-
61
-
62
-
63
-
64
-
65
-
66
-
67
-
68
-
69
-
70
-
71
-
72
-
73
-
74
-
75
-
76
-
77
-
78
-
79
-
80
-
81
-
82
-
83
-
84
-
85
-
86
-
87
-
88
-
89
-
90
-
91
-
92
-
93
-
94
-
95
-
96
-
97
-
98
-
99
-
100
-
101
-
102
-
103
-
104
-
105
-
106
-
107
-
108
-
109
-
110
-
111
-
112
-
113
-
114
-
115
-
116
-
117
-
118
-
119
-
120
-
121
-
122
-
123
-
124
-
125
-
126
-
127
-
128
-
129
-
130
-
131
-
132
-
133
-
134
-
135
-
136
-
137
-
138
-
139
-
140
-
141
-
142
-
143
-
144
-
145
-
146
-
147
-
148
-
149
-
150
-
151
-
152
-
153
-
154
-
155
-
156
-
157
-
158
-
159
-
160
-
161
-
162
-
163
-
164
-
165
-
166
-
167
-
168
-
169
-
170
-
171
-
172
-
173
-
174
-
175
-
176
-
177
-
178
-
179
-
180
-
181
-
182
-
183
-
184
-
185
-
186
-
187
-
188
-
189
-
190
-
191
-
192
-
193
-
194
-
195
-
196
-
197
-
198
-
199
-
200
-
201
-
202
-
203
-
 204
204 -
 205
205 -
 206
206 -
 207
207 -
 208
208 -
 209
209 -
 210
210 -
 211
211 -
 212
212 -
 213
213 -
 214
214 -
 215
215 -
 216
216 -
 217
217 -
 218
218 -
 219
219 -
 220
220 -
 221
221 -
 222
222 -
 223
223 -
 224
224 -
225
-
226
-
227
-
228
-
229
-
230
-
231
-
232
-
233
-
234
-
235
-
236
-
237
-
238
-
239
-
240
-
241
-
242
-
243
-
244
-
245
-
246
-
247
-
248
-
249
-
250
-
251
-
252
 |
 |

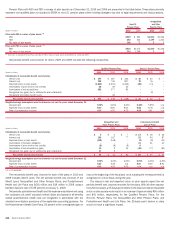
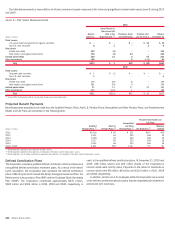
NOTE 17 Earnings Per Common Share
The calculation of EPS and diluted EPS for 2010, 2009 and 2008 is presented below. See Note 1 — Summary of Significant Accounting Principles for additional
information on the calculation of EPS.
(Dollars in millions, except per share information; shares in thousands)
2010 2009 2008
Earnings (loss) per common share
Net income (loss)
$ (2,238)
$6,276 $4,008
Preferred stock dividends
(1,357)
(4,494) (1,452)
Accelerated accretion from redemption of preferred stock issued to the U.S. Treasury
–
(3,986) –
Net income (loss) applicable to common shareholders
(3,595)
(2,204) 2,556
Dividends and undistributed earnings allocated to participating securities
(4)
(6) (69)
Net income (loss) allocated to common shareholders
$ (3,599)
$ (2,210) $ 2,487
Average common shares issued and outstanding
9,790,472
7,728,570 4,592,085
Earnings (loss) per common share
$ (0.37)
$ (0.29) $ 0.54
Diluted earnings (loss) per common share
Net income (loss) applicable to common shareholders
$ (3,595)
$ (2,204) $ 2,556
Dividends and undistributed earnings allocated to participating securities
(4)
(6) (69)
Net income (loss) allocated to common shareholders
$ (3,599)
$ (2,210) $ 2,487
Average common shares issued and outstanding
9,790,472
7,728,570 4,592,085
Dilutive potential common shares
(1)
–
–4,343
Total diluted average common shares issued and outstanding
9,790,472
7,728,570 4,596,428
Diluted earnings (loss) per common share
$ (0.37)
$ (0.29) $ 0.54
(1)
Includes incremental shares from RSUs, restricted stock shares, stock options and warrants.
Due to the net loss applicable to common shareholders for 2010 and
2009, no dilutive potential common shares were included in the calculation of
diluted EPS because they would have been antidilutive.
For 2010, 2009 and 2008, average options to purchase 271 million,
315 million and 181 million shares, respectively, of common stock were
outstanding but not included in the computation of EPS because they were
antidilutive under the treasury stock method. For 2010 and 2009, average
warrants to purchase 272 million and 265 million shares of common stock
were outstanding but not included in the computation of EPS because they
were antidilutive under the treasury stock method. For 2010 and 2009,
107 million and 147 million average dilutive potential common shares as-
sociated with the convertible Series L Preferred Stock, and the mandatory
convertible Preferred Stock Series 2 and Series 3 of Merrill Lynch were
excluded from the diluted share count because the result would have been
antidilutive under the “if-converted” method. For 2009, 81 million average
dilutive potential common shares associated with the CES were also excluded
from the diluted share count because the result would have been antidilutive
under the “if-converted” method. For 2008, 128 million average dilutive
potential common shares associated with the convertible Series L Preferred
Stock were excluded from the diluted share count because the result would
have been antidilutive under the “if-converted” method.
For purposes of computing basic EPS, CES were considered to be par-
ticipating securities prior to February 24, 2010, however, due to a net loss for
2010, CES were not allocated earnings. The two-class method prohibits the
allocation of an undistributed loss to participating securities. For purposes of
computing diluted EPS, there was no dilutive effect of the CES, which were
outstanding prior to February 24, 2010, due to a net loss for 2010.
For 2009, as a result of repurchasing the TARP Preferred Stock, the
Corporation accelerated the remaining accretion of the issuance discount on
the TARP Preferred Stock of $4.0 billion and recorded a corresponding charge
to retained earnings and income (loss) applicable to common shareholders in
the calculation of diluted earnings per common share. In addition, in 2009,
the Corporation recorded an increase to retained earnings and net income
(loss) available to common shareholders of $576 million related to the
Corporation’s preferred stock exchange for common stock.
NOTE 18 Regulatory Requirements and
Restrictions
The Federal Reserve requires the Corporation’s banking subsidiaries to
maintain reserve balances based on a percentage of certain deposits. Aver-
age daily reserve balances required by the Federal Reserve were $12.9 billion
and $10.9 billion for 2010 and 2009. Currency and coin residing in branches
and cash vaults (vault cash) are used to partially satisfy the reserve require-
ment. The average daily reserve balances, in excess of vault cash, held with
the Federal Reserve amounted to $5.5 billion and $3.4 billion for 2010 and
2009.
The primary sources of funds for cash distributions by the Corporation to
its shareholders are dividends received from its banking subsidiaries, Bank of
America, N.A. and FIA Card Services, N.A. In 2010, the Corporation received
$4.6 billion in dividends from Bank of America, N.A. In 2011, Bank of America,
N.A. and FIA Card Services, N.A. can declare and pay dividends to the
Corporation of $5.8 billion and $0 plus an additional amount equal to their
net profits for 2011, as defined by statute, up to the date of any such dividend
declaration. The other subsidiary national banks can pay dividends in aggre-
gate in 2011 of $53 million plus an additional amount equal to their net profits
for 2011, as defined by statute, up to the date of any such dividend decla-
ration. The amount of dividends that each subsidiary bank may declare in a
calendar year without approval by the OCC is the subsidiary bank’s net profits
for that year combined with its net retained profits, as defined, for the
preceding two years.
The Federal Reserve, OCC, FDIC and Office of Thrift Supervision (collec-
tively, joint agencies) have in place regulatory capital guidelines for U.S. bank-
ing organizations. Failure to meet the capital requirements can initiate certain
mandatory and discretionary actions by regulators that could have a material
effect on the Corporation’s financial position. The regulatory capital guide-
lines measure capital in relation to the credit and market risks of both on- and
off-balance sheet items using various risk weights. Under the regulatory
capital guidelines, Total capital consists of three tiers of capital. Tier 1 capital
includes qualifying common shareholders’ equity, CES, qualifying noncumu-
lative perpetual preferred stock, qualifying Trust Securities, hybrid securities
and qualifying non-controlling interests, less goodwill and other adjustments.
Tier 2 capital consists of qualifying subordinated debt, a limited portion of the
212 Bank of America 2010