Bank of America 2010 Annual Report Download - page 137
Download and view the complete annual report
Please find page 137 of the 2010 Bank of America annual report below. You can navigate through the pages in the report by either clicking on the pages listed below, or by using the keyword search tool below to find specific information within the annual report.-
 1
1 -
2
-
3
-
4
-
5
-
6
-
7
-
8
-
9
-
10
-
11
-
12
-
13
-
14
-
15
-
16
-
17
-
18
-
19
-
20
-
21
-
22
-
23
-
24
-
25
-
26
-
27
-
28
-
29
-
30
-
31
-
32
-
33
-
34
-
35
-
36
-
37
-
38
-
39
-
40
-
41
-
42
-
43
-
44
-
45
-
46
-
47
-
48
-
49
-
50
-
51
-
52
-
53
-
54
-
55
-
56
-
57
-
58
-
59
-
60
-
61
-
62
-
63
-
64
-
65
-
66
-
67
-
68
-
69
-
70
-
71
-
72
-
73
-
74
-
75
-
76
-
77
-
78
-
79
-
80
-
81
-
82
-
83
-
84
-
85
-
86
-
87
-
88
-
89
-
90
-
91
-
92
-
93
-
94
-
95
-
96
-
97
-
98
-
99
-
100
-
101
-
102
-
103
-
104
-
105
-
106
-
107
-
108
-
109
-
110
-
111
-
112
-
113
-
114
-
115
-
116
-
117
-
118
-
119
-
120
-
121
-
122
-
123
-
124
-
125
-
126
-
 127
127 -
 128
128 -
 129
129 -
 130
130 -
 131
131 -
 132
132 -
 133
133 -
 134
134 -
 135
135 -
 136
136 -
 137
137 -
 138
138 -
 139
139 -
 140
140 -
 141
141 -
 142
142 -
 143
143 -
 144
144 -
 145
145 -
 146
146 -
 147
147 -
148
-
149
-
150
-
151
-
152
-
153
-
154
-
155
-
156
-
157
-
158
-
159
-
160
-
161
-
162
-
163
-
164
-
165
-
166
-
167
-
168
-
169
-
170
-
171
-
172
-
173
-
174
-
175
-
176
-
177
-
178
-
179
-
180
-
181
-
182
-
183
-
184
-
185
-
186
-
187
-
188
-
189
-
190
-
191
-
192
-
193
-
194
-
195
-
196
-
197
-
198
-
199
-
200
-
201
-
202
-
203
-
204
-
205
-
206
-
207
-
208
-
209
-
210
-
211
-
212
-
213
-
214
-
215
-
216
-
217
-
218
-
219
-
220
-
221
-
222
-
223
-
224
-
225
-
226
-
227
-
228
-
229
-
230
-
231
-
232
-
233
-
234
-
235
-
236
-
237
-
238
-
239
-
240
-
241
-
242
-
243
-
244
-
245
-
246
-
247
-
248
-
249
-
250
-
251
-
252
 |
 |

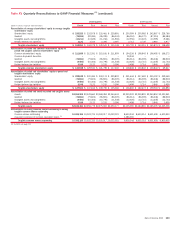
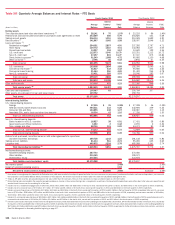
Table XVI Quarterly Average Balances and Interest Rates – FTE Basis (continued)
(Dollars in millions)
Average
Balance
Interest
Income/
Expense
Yield/
Rate
Average
Balance
Interest
Income/
Expense
Yield/
Rate
Average
Balance
Interest
Income/
Expense
Yield/
Rate
Second Quarter 2010 First Quarter 2010 Fourth Quarter 2009
Earning assets
Time deposits placed and other short-term investments
(1)
$ 30,741 $ 70 0.93% $ 27,600 $ 61 0.89% $ 28,566 $ 90 1.25%
Federal funds sold and securities borrowed or purchased under
agreements to resell 263,564 457 0.70 266,070 448 0.68 244,914 327 0.53
Trading account assets 213,927 1,853 3.47 214,542 1,795 3.37 218,787 1,800 3.28
Debt securities
(2)
314,299 2,966 3.78 311,136 3,173 4.09 279,231 2,921 4.18
Loans and leases
(3)
:
Residential mortgage
(4)
247,715 2,982 4.82 243,833 3,100 5.09 236,883 3,108 5.24
Home equity 148,219 1,537 4.15 152,536 1,586 4.20 150,704 1,613 4.26
Discontinued real estate 13,972 134 3.84 14,433 153 4.24 15,152 174 4.58
U.S. credit card 118,738 3,121 10.54 125,353 3,370 10.90 49,213 1,336 10.77
Non-U.S. credit card 27,706 854 12.37 29,872 906 12.30 21,680 605 11.08
Direct/Indirect consumer
(5)
98,549 1,233 5.02 100,920 1,302 5.23 98,938 1,361 5.46
Other consumer
(6)
2,958 46 6.32 3,002 48 6.35 3,177 50 6.33
Total consumer 657,857 9,907 6.03 669,949 10,465 6.30 575,747 8,247 5.70
U.S. commercial 195,144 2,005 4.12 202,662 1,970 3.94 207,050 2,090 4.01
Commercial real estate
(7)
64,218 541 3.38 68,526 575 3.40 71,352 595 3.31
Commercial lease financing 21,271 261 4.90 21,675 304 5.60 21,769 273 5.04
Non-U.S. commercial 28,564 256 3.59 28,803 264 3.72 29,995 287 3.78
Total commercial 309,197 3,063 3.97 321,666 3,113 3.92 330,166 3,245 3.90
Total loans and leases 967,054 12,970 5.38 991,615 13,578 5.53 905,913 11,492 5.05
Other earning assets 121,205 994 3.29 122,097 1,053 3.50 130,487 1,222 3.72
Total earning assets
(8)
1,910,790 19,310 4.05 1,933,060 20,108 4.19 1,807,898 17,852 3.93
Cash and cash equivalents
(1)
209,686 106 196,911 92 230,618 130
Other assets, less allowance for loan and lease losses 373,956 386,619 392,508
Total assets
$2,494,432 $2,516,590 $2,431,024
Interest-bearing liabilities
U.S. interest-bearing deposits:
Savings $ 37,290 $ 43 0.46% $ 35,126 $ 43 0.50% $ 33,749 $ 54 0.63%
NOW and money market deposit accounts 442,262 372 0.34 416,110 341 0.33 392,212 388 0.39
Consumer CDs and IRAs 147,425 441 1.20 166,189 567 1.38 192,779 835 1.72
Negotiable CDs, public funds and other time deposits 17,355 59 1.36 19,763 63 1.31 31,758 82 1.04
Total U.S. interest-bearing deposits 644,332 915 0.57 637,188 1,014 0.65 650,498 1,359 0.83
Non-U.S. interest-bearing deposits:
Banks located in non-U.S. countries 19,751 36 0.72 18,424 32 0.71 16,132 30 0.75
Governments and official institutions 4,214 3 0.28 5,626 3 0.22 5,779 4 0.26
Time, savings and other 52,195 77 0.60 54,885 73 0.53 55,685 79 0.56
Total non-U.S. interest-bearing deposits 76,160 116 0.61 78,935 108 0.55 77,596 113 0.58
Total interest-bearing deposits 720,492 1,031 0.57 716,123 1,122 0.64 728,094 1,472 0.80
Federal funds purchased, securities loaned or sold under agreements to
repurchase and other short-term borrowings 454,051 891 0.79 508,332 818 0.65 450,538 658 0.58
Trading account liabilities 100,021 715 2.87 90,134 660 2.97 83,118 591 2.82
Long-term debt 497,469 3,582 2.88 513,634 3,530 2.77 445,440 3,365 3.01
Total interest-bearing liabilities
(8)
1,772,033 6,219 1.41 1,828,223 6,130 1.35 1,707,190 6,086 1.42
Noninterest-bearing sources:
Noninterest-bearing deposits 271,123 264,892 267,066
Other liabilities 217,815 193,584 206,169
Shareholders’ equity 233,461 229,891 250,599
Total liabilities and shareholders’ equity
$2,494,432 $2,516,590 $2,431,024
Net interest spread 2.64% 2.84% 2.51%
Impact of noninterest-bearing sources 0.10 0.08 0.08
Net interest income/yield on earning assets
(1)
$13,091 2.74% $13,978 2.92% $11,766 2.59%
For footnotes, see page 134.
Bank of America 2010 135