Bank of America 2010 Annual Report Download - page 92
Download and view the complete annual report
Please find page 92 of the 2010 Bank of America annual report below. You can navigate through the pages in the report by either clicking on the pages listed below, or by using the keyword search tool below to find specific information within the annual report.-
 1
1 -
2
-
3
-
4
-
5
-
6
-
7
-
8
-
9
-
10
-
11
-
12
-
13
-
14
-
15
-
16
-
17
-
18
-
19
-
20
-
21
-
22
-
23
-
24
-
25
-
26
-
27
-
28
-
29
-
30
-
31
-
32
-
33
-
34
-
35
-
36
-
37
-
38
-
39
-
40
-
41
-
42
-
43
-
44
-
45
-
46
-
47
-
48
-
49
-
50
-
51
-
52
-
53
-
54
-
55
-
56
-
57
-
58
-
59
-
60
-
61
-
62
-
63
-
64
-
65
-
66
-
67
-
68
-
69
-
70
-
71
-
72
-
73
-
74
-
75
-
76
-
77
-
78
-
79
-
80
-
81
-
 82
82 -
 83
83 -
 84
84 -
 85
85 -
 86
86 -
 87
87 -
 88
88 -
 89
89 -
 90
90 -
 91
91 -
 92
92 -
 93
93 -
 94
94 -
 95
95 -
 96
96 -
 97
97 -
 98
98 -
 99
99 -
 100
100 -
 101
101 -
 102
102 -
103
-
104
-
105
-
106
-
107
-
108
-
109
-
110
-
111
-
112
-
113
-
114
-
115
-
116
-
117
-
118
-
119
-
120
-
121
-
122
-
123
-
124
-
125
-
126
-
127
-
128
-
129
-
130
-
131
-
132
-
133
-
134
-
135
-
136
-
137
-
138
-
139
-
140
-
141
-
142
-
143
-
144
-
145
-
146
-
147
-
148
-
149
-
150
-
151
-
152
-
153
-
154
-
155
-
156
-
157
-
158
-
159
-
160
-
161
-
162
-
163
-
164
-
165
-
166
-
167
-
168
-
169
-
170
-
171
-
172
-
173
-
174
-
175
-
176
-
177
-
178
-
179
-
180
-
181
-
182
-
183
-
184
-
185
-
186
-
187
-
188
-
189
-
190
-
191
-
192
-
193
-
194
-
195
-
196
-
197
-
198
-
199
-
200
-
201
-
202
-
203
-
204
-
205
-
206
-
207
-
208
-
209
-
210
-
211
-
212
-
213
-
214
-
215
-
216
-
217
-
218
-
219
-
220
-
221
-
222
-
223
-
224
-
225
-
226
-
227
-
228
-
229
-
230
-
231
-
232
-
233
-
234
-
235
-
236
-
237
-
238
-
239
-
240
-
241
-
242
-
243
-
244
-
245
-
246
-
247
-
248
-
249
-
250
-
251
-
252
 |
 |

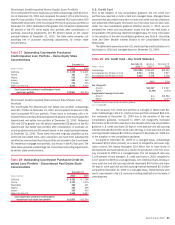
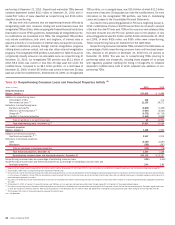
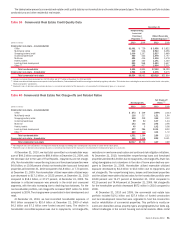
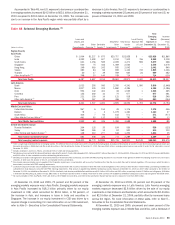
The table below presents outstanding commercial real estate loans by geographic region and property type. Commercial real estate primarily includes
commercial loans and leases secured by non owner-occupied real estate which are dependent on the sale or lease of the real estate as the primary source of
repayment. The decline in California is due primarily to the sale of First Republic.
Table 38 Outstanding Commercial Real Estate Loans
(Dollars in millions)
2010 2009
December 31
By Geographic Region
(1)
California
$9,012
$14,554
Northeast
7,639
12,089
Southwest
6,169
8,641
Southeast
5,806
7,019
Midwest
5,301
6,662
Florida
3,649
4,589
Illinois
2,811
4,527
Midsouth
2,627
3,459
Northwest
2,243
3,097
Non-U.S.
2,515
2,994
Other
(2)
1,701
1,906
Total outstanding commercial real estate loans
(3)
$49,473
$69,537
By Property Type
Office
$9,688
$12,511
Multi-family rental
7,721
11,169
Shopping centers/retail
7,484
9,519
Industrial/warehouse
5,039
5,852
Homebuilder
(4)
4,299
7,250
Multi-use
4,266
5,924
Hotels/motels
2,650
6,946
Land and land development
2,376
3,215
Other
(5)
5,950
7,151
Total outstanding commercial real estate loans
(3)
$49,473
$69,537
(1)
Distribution is based on geographic location of collateral.
(2)
Includes unsecured outstandings to real estate investment trusts and national home builders whose portfolios of properties span multiple geographic regions and properties in the states of Colorado, Utah, Hawaii, Wyoming and
Montana.
(3)
Includes commercial real estate loans accounted for under the fair value option of $79 million and $90 million at December 31, 2010 and 2009.
(4)
Homebuilder includes condominiums and residential land.
(5)
Represents loans to borrowers whose primary business is commercial real estate, but the exposure is not secured by the listed property types or is unsecured.
During 2010, we continued to see stabilization in the homebuilder portfolio. Certain portions of the non-homebuilder portfolio remain most at-risk as
occupancy rates, rental rates and commercial property prices remain under pressure. We have adopted a number of proactive risk mitigation initiatives to
reduce utilized and potential exposure in the commercial real estate portfolios.
90 Bank of America 2010