Bank of America 2010 Annual Report Download - page 174
Download and view the complete annual report
Please find page 174 of the 2010 Bank of America annual report below. You can navigate through the pages in the report by either clicking on the pages listed below, or by using the keyword search tool below to find specific information within the annual report.-
 1
1 -
2
-
3
-
4
-
5
-
6
-
7
-
8
-
9
-
10
-
11
-
12
-
13
-
14
-
15
-
16
-
17
-
18
-
19
-
20
-
21
-
22
-
23
-
24
-
25
-
26
-
27
-
28
-
29
-
30
-
31
-
32
-
33
-
34
-
35
-
36
-
37
-
38
-
39
-
40
-
41
-
42
-
43
-
44
-
45
-
46
-
47
-
48
-
49
-
50
-
51
-
52
-
53
-
54
-
55
-
56
-
57
-
58
-
59
-
60
-
61
-
62
-
63
-
64
-
65
-
66
-
67
-
68
-
69
-
70
-
71
-
72
-
73
-
74
-
75
-
76
-
77
-
78
-
79
-
80
-
81
-
82
-
83
-
84
-
85
-
86
-
87
-
88
-
89
-
90
-
91
-
92
-
93
-
94
-
95
-
96
-
97
-
98
-
99
-
100
-
101
-
102
-
103
-
104
-
105
-
106
-
107
-
108
-
109
-
110
-
111
-
112
-
113
-
114
-
115
-
116
-
117
-
118
-
119
-
120
-
121
-
122
-
123
-
124
-
125
-
126
-
127
-
128
-
129
-
130
-
131
-
132
-
133
-
134
-
135
-
136
-
137
-
138
-
139
-
140
-
141
-
142
-
143
-
144
-
145
-
146
-
147
-
148
-
149
-
150
-
151
-
152
-
153
-
154
-
155
-
156
-
157
-
158
-
159
-
160
-
161
-
162
-
163
-
 164
164 -
 165
165 -
 166
166 -
 167
167 -
 168
168 -
 169
169 -
 170
170 -
 171
171 -
 172
172 -
 173
173 -
 174
174 -
 175
175 -
 176
176 -
 177
177 -
 178
178 -
 179
179 -
 180
180 -
 181
181 -
 182
182 -
 183
183 -
 184
184 -
185
-
186
-
187
-
188
-
189
-
190
-
191
-
192
-
193
-
194
-
195
-
196
-
197
-
198
-
199
-
200
-
201
-
202
-
203
-
204
-
205
-
206
-
207
-
208
-
209
-
210
-
211
-
212
-
213
-
214
-
215
-
216
-
217
-
218
-
219
-
220
-
221
-
222
-
223
-
224
-
225
-
226
-
227
-
228
-
229
-
230
-
231
-
232
-
233
-
234
-
235
-
236
-
237
-
238
-
239
-
240
-
241
-
242
-
243
-
244
-
245
-
246
-
247
-
248
-
249
-
250
-
251
-
252
 |
 |

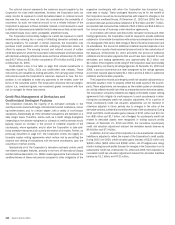
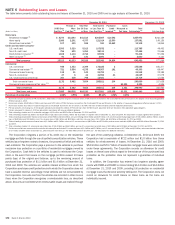
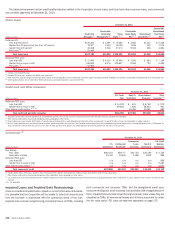
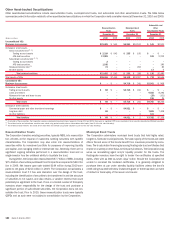
The tables below present certain credit quality indicators related to the Corporation’s home loans, credit card and other consumer loans, and commercial
loan portfolio segments at December 31, 2010.
Home Loans
(Dollars in millions)
Residential
Mortgage
(1)
Countrywide
Residential
Mortgage PCI
(2)
Home
Equity
(1, 3)
Countrywide
Home Equity
PCI
(2, 3)
Discontinued
Real Estate
(1)
Countrywide
Discontinued
Real Estate
PCI
(2)
December 31, 2010
Refreshed LTV
Less than 90 percent $130,260 $ 3,390 $ 73,680 $ 1,883 $1,033 $ 5,248
Greater than 90 percent but less than 100 percent 19,907 1,654 14,038 1,186 155 1,578
Greater than 100 percent 43,268 5,548 37,673 9,521 268 4,826
FHA Loans
(4)
53,946 – – – – –
Total home loans $247,381 $10,592 $125,391 $12,590 $1,456 $11,652
Refreshed FICO score
Less than 620 $ 27,483 $ 4,016 $ 15,494 $ 3,206 $ 663 $ 7,168
Greater than or equal to 620 165,952 6,576 109,897 9,384 793 4,484
FHA Loans
(4)
53,946 – – – – –
Total home loans $247,381 $10,592 $125,391 $12,590 $1,456 $11,652
(1)
Excludes Countrywide PCI loans.
(2)
Excludes PCI home loans related to the Merrill Lynch acquisition.
(3)
Refreshed LTV is reported using a combined LTV, which measures the carrying value of the combined loans with liens against the property and the available line of credit as a percentage of the appraised value securing the loan.
(4)
Credit quality indicators are not reported for FHA insured loans as principal repayment is insured by the FHA.
Credit Card and Other Consumer
(Dollars in millions)
U.S. Credit
Card
Non-U.S.
Credit Card
Direct/Indirect
Consumer
Other
Consumer
(1)
December 31, 2010
Refreshed FICO score
Less than 620 $ 14,159 $ 631 $ 6,748 $ 979
Greater than or equal to 620 99,626 7,528 48,209 961
Other internal credit metrics
(2, 3, 4)
– 19,306 35,351 890
Total credit card and other consumer $113,785 $27,465 $90,308 $2,830
(1)
96 percent of the other consumer portfolio was associated with portfolios from certain consumer finance businesses that have been previously exited by the Corporation.
(2)
Other internal credit metrics may include delinquency status, geography or other factors.
(3)
Direct/indirect consumer includes $24.0 billion of securities-based lending which is overcollateralized and therefore offers minimal credit risk and $7.4 billion of loans the Corporation no longer originates.
(4)
Non-U.S. credit card represents the select European countries’ credit card portfolio and a portion of the Canadian credit card portfolio which is evaluated using internal credit metrics, including delinquency status. At December 31,
2010, 95 percent of this portfolio was current or less than 30 days past due, three percent was 30-89 days past due and two percent was 90 days or more past due.
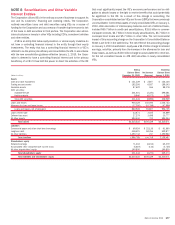
Commercial
(1)
(Dollars in millions)
U.S.
Commercial
Commercial
Real Estate
Commercial
Lease
Financing
Non-U.S.
Commercial
U.S. Small
Business
Commercial
December 31, 2010
Risk Ratings
Pass rated $160,154 $29,757 $20,754 $30,180 $ 3,139
Reservable criticized 15,432 19,636 1,188 1,849 988
Refreshed FICO score
Less than 620 n/a n/a n/a n/a 888
Greater than or equal to 620 n/a n/a n/a n/a 5,083
Other internal credit metrics
(2, 3)
n/a n/a n/a n/a 4,621
Total commercial credit $175,586 $49,393 $21,942 $32,029 $14,719
(1)
Includes $204 million of PCI loans related to the commercial portfolio segment and excludes $3.3 billion of loans accounted for under the fair value option.
(2)
Other internal credit metrics may include delinquency status, application scores, geography or other factors.
(3)
U.S. small business commercial includes business card and small business loans which are evaluated using internal credit metrics, including delinquency status. At December 31, 2010, 95 percent was current or less than 30 days
past due.
n/a = not applicable
Impaired Loans and Troubled Debt Restructurings
A loan is considered impaired when, based on current information and events,
it is probable that the Corporation will be unable to collect all amounts due
from the borrower in accordance with the contractual terms of the loan.
Impaired loans include nonper forming commercial loans, all TDRs, including
both commercial and consumer TDRs, and the renegotiated credit card,
consumer lending and small business loan portfolios (the renegotiated port-
folio). Impaired loans exclude nonperforming consumer loans unless they are
classified as TDRs, all commercial leases and all loans accounted for under
the fair value option. PCI loans are reported separately on page 175.
172 Bank of America 2010