Bank of America 2010 Annual Report Download - page 32
Download and view the complete annual report
Please find page 32 of the 2010 Bank of America annual report below. You can navigate through the pages in the report by either clicking on the pages listed below, or by using the keyword search tool below to find specific information within the annual report.-
 1
1 -
2
-
3
-
4
-
5
-
6
-
7
-
8
-
9
-
10
-
11
-
12
-
13
-
14
-
15
-
16
-
17
-
18
-
19
-
20
-
21
-
 22
22 -
 23
23 -
 24
24 -
 25
25 -
 26
26 -
 27
27 -
 28
28 -
 29
29 -
 30
30 -
 31
31 -
 32
32 -
 33
33 -
 34
34 -
 35
35 -
 36
36 -
 37
37 -
 38
38 -
 39
39 -
 40
40 -
 41
41 -
 42
42 -
43
-
44
-
45
-
46
-
47
-
48
-
49
-
50
-
51
-
52
-
53
-
54
-
55
-
56
-
57
-
58
-
59
-
60
-
61
-
62
-
63
-
64
-
65
-
66
-
67
-
68
-
69
-
70
-
71
-
72
-
73
-
74
-
75
-
76
-
77
-
78
-
79
-
80
-
81
-
82
-
83
-
84
-
85
-
86
-
87
-
88
-
89
-
90
-
91
-
92
-
93
-
94
-
95
-
96
-
97
-
98
-
99
-
100
-
101
-
102
-
103
-
104
-
105
-
106
-
107
-
108
-
109
-
110
-
111
-
112
-
113
-
114
-
115
-
116
-
117
-
118
-
119
-
120
-
121
-
122
-
123
-
124
-
125
-
126
-
127
-
128
-
129
-
130
-
131
-
132
-
133
-
134
-
135
-
136
-
137
-
138
-
139
-
140
-
141
-
142
-
143
-
144
-
145
-
146
-
147
-
148
-
149
-
150
-
151
-
152
-
153
-
154
-
155
-
156
-
157
-
158
-
159
-
160
-
161
-
162
-
163
-
164
-
165
-
166
-
167
-
168
-
169
-
170
-
171
-
172
-
173
-
174
-
175
-
176
-
177
-
178
-
179
-
180
-
181
-
182
-
183
-
184
-
185
-
186
-
187
-
188
-
189
-
190
-
191
-
192
-
193
-
194
-
195
-
196
-
197
-
198
-
199
-
200
-
201
-
202
-
203
-
204
-
205
-
206
-
207
-
208
-
209
-
210
-
211
-
212
-
213
-
214
-
215
-
216
-
217
-
218
-
219
-
220
-
221
-
222
-
223
-
224
-
225
-
226
-
227
-
228
-
229
-
230
-
231
-
232
-
233
-
234
-
235
-
236
-
237
-
238
-
239
-
240
-
241
-
242
-
243
-
244
-
245
-
246
-
247
-
248
-
249
-
250
-
251
-
252
 |
 |

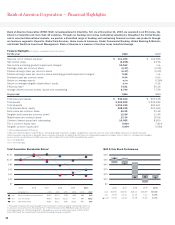
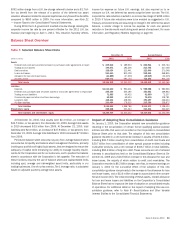
$10.4 billion in Global Card Services and $2.0 billion in Home Loans &
Insurance. For more information about the goodwill impairment charges in
2010, see Complex Accounting Estimates beginning on page 111 and
Note 10 – Goodwill and Intangible Assets to the Consolidated Financial
Statements.
Excluding the $12.4 billion of goodwill impairment charges, net income
was $10.2 billion for 2010. After preferred stock dividends and accretion, net
income applicable to common shareholders, excluding the goodwill impair-
ment charges was $8.8 billion, or $0.86 per diluted common share, for 2010.
Revenue, net of interest expense on a FTE basis decreased $9.6 billion or
eight percent to $111.4 billion in 2010.
Net interest income on a FTE basis increased $4.3 billion to $52.7 billion
for 2010 compared to 2009. The increase was due to the impact of deposit
pricing and the adoption of new consolidation guidance. The increase was
partially offset by lower commercial and consumer loan levels and lower rates
on the core assets and trading assets and liabilities.
Noninterest income decreased $13.8 billion to $58.7 billion in 2010
compared to $72.5 billion in 2009. Contributing to the decline was lower
mortgage banking income, down $6.1 billion, largely due to $6.8 billion in
representations and warranties provision, and decreases in equity investment
income of $4.8 billion, gains on sales of debt securities of $2.2 billion, trading
account profits of $2.2 billion, service charges of $1.6 billion and insurance
income of $694 million, compared to 2009. These declines were partially
offset by an increase in other income of $2.4 billion and a decrease in
impairment losses of $1.9 billion.
Representations and warranties expense increased $4.9 billion to $6.8 bil-
lion in 2010 compared to $1.9 billion in 2009. The increase was primarily driven
by a $4.1 billion provision for representations and warranties in the fourth
quarter of 2010. The fourth quarter provision includes $3.0 billion related to
the impact of the agreements reached with the GSEs on December 31, 2010,
pursuant to which we paid $2.8 billion to resolve repurchase claims involving
certain residential mortgage loans sold directly to the GSEs by entities related
to legacy Countrywide Financial Corporation (Countrywide) as well as adjust-
ments made to the representations and warranties liability for other loans sold
directly to the GSEs and not covered by these agreements. For more
information about the GSE agreements, see Recent Events beginning on
page 37 and Note 9 – Representations and Warranties Obligations and Cor-
porate Guarantees to the Consolidated Financial Statements.
The provision for credit losses decreased $20.1 billion to $28.4 billion in
2010 compared to 2009. The provision for credit losses was $5.9 billion
lower than net charge-offs in 2010, resulting in a reduction in reserves,
compared with the 2009 provision for credit losses that was $14.9 billion
higher than net charge-offs, reflecting reserve additions throughout the year.
The reserve reduction in 2010 was due to improving portfolio trends across
most of the consumer and commercial businesses, particularly the U.S. credit
card, consumer lending and small business products, as well as core com-
mercial loan portfolios.
Noninterest expense increased $16.4 billion to $83.1 billion in 2010
compared to 2009. The increase was driven by the $12.4 billion of goodwill
impairment charges recognized in 2010. Excluding the goodwill impairment
charges, noninterest expense increased $4.0 billion in 2010 compared to
2009, driven by a $3.6 billion increase in personnel costs reflecting the build-
out of several businesses and a $1.6 billion increase in litigation expense,
partially offset by lower merger and restructuring charges.
FTE basis, net income excluding the goodwill impairment charges, non-
interest expense excluding goodwill impairment charges and net income
applicable to common shareholders excluding the goodwill impairment
charges are non-GAAP measures. For corresponding reconciliations to GAAP
financial measures, see Table XIII.
Segment Results
Effective January 1, 2010, management realigned the former Global Banking
and Global Markets business segments into Global Commercial Banking and
GBAM. Prior year amounts have been reclassified to conform to the current
period presentation. These changes did not have an impact on the previously
reported consolidated results of the Corporation. For additional information
related to the business segments, see Note 26 – Business Segment Infor-
mation to the Consolidated Financial Statements.
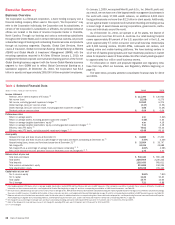
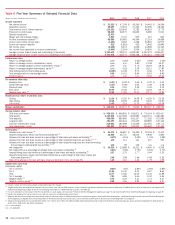
Table 2 Business Segment Results
(Dollars in millions)
2010 2009 2010 2009
Total Revenue
(1)
Net Income (Loss)
Deposits
$13,181
$13,890
$1,352
$2,576
Global Card Services
(2)
25,621
29,046
(6,603)
(5,261)
Home Loans & Insurance
10,647
16,903
(8,921)
(3,851)
Global Commercial Banking
10,903
11,141
3,181
(290)
Global Banking & Markets
28,498
32,623
6,319
10,058
Global Wealth & Investment Management
16,671
16,137
1,347
1,716
All Other
(2)
5,869
1,204
1,087
1,328
Total FTE basis
111,390
120,944
(2,238)
6,276
FTE adjustment
(1,170)
(1,301)
–
–
Total Consolidated
$110,220
$119,643
$(2,238)
$6,276
(1)
Total revenue is net of interest expense and is on a FTE basis which is a non-GAAP measure. For more information on this measure, see Supplemental Financial Data beginning on page 40, and for a corresponding reconciliation to a
GAAP financial measure, see Table XIII.
(2)
In 2010, Global Card Services and All Other are presented in accordance with new consolidation guidance. Accordingly, current year Global Card Services results are comparable toprior year results which are presented on a managed
basis. For more information on the reconciliation of Global Card Services and All Other,seeNote 26 – Business Segment Information to the Consolidated Financial Statements.
Deposits net income decreased from the prior year due to a decline in
revenue and higher noninterest expense. Net interest income increased as a
result of a customer shift to more liquid products and continued pricing disci-
pline, partially offset by a lower net interest income allocation related to asset
and liability management (ALM) activities. The noninterest income decline was
driven by the impact of Regulation E, which was effective in the third quarter of
2010 and our overdraft policy changes implemented in late 2009. Noninterest
expense increased as a higher proportion of banking center sales and service
costs was aligned to Deposits from the other segments, and increased litigation
expenses. The increase was partially offset by the absence of a special Federal
Deposit Insurance Corporation (FDIC) assessment in 2009.
Global Card Services net loss increased compared to the prior year due
primarily to a $10.4 billion goodwill impairment charge. Revenue decreased
compared to the prior year driven by lower average loans, reduced interest and
fee income primarily resulting from the implementation of the CARD Act and
the impact of recording a reserve related to future payment protection
30 Bank of America 2010