Bank of America 2010 Annual Report Download - page 178
Download and view the complete annual report
Please find page 178 of the 2010 Bank of America annual report below. You can navigate through the pages in the report by either clicking on the pages listed below, or by using the keyword search tool below to find specific information within the annual report.-
 1
1 -
2
-
3
-
4
-
5
-
6
-
7
-
8
-
9
-
10
-
11
-
12
-
13
-
14
-
15
-
16
-
17
-
18
-
19
-
20
-
21
-
22
-
23
-
24
-
25
-
26
-
27
-
28
-
29
-
30
-
31
-
32
-
33
-
34
-
35
-
36
-
37
-
38
-
39
-
40
-
41
-
42
-
43
-
44
-
45
-
46
-
47
-
48
-
49
-
50
-
51
-
52
-
53
-
54
-
55
-
56
-
57
-
58
-
59
-
60
-
61
-
62
-
63
-
64
-
65
-
66
-
67
-
68
-
69
-
70
-
71
-
72
-
73
-
74
-
75
-
76
-
77
-
78
-
79
-
80
-
81
-
82
-
83
-
84
-
85
-
86
-
87
-
88
-
89
-
90
-
91
-
92
-
93
-
94
-
95
-
96
-
97
-
98
-
99
-
100
-
101
-
102
-
103
-
104
-
105
-
106
-
107
-
108
-
109
-
110
-
111
-
112
-
113
-
114
-
115
-
116
-
117
-
118
-
119
-
120
-
121
-
122
-
123
-
124
-
125
-
126
-
127
-
128
-
129
-
130
-
131
-
132
-
133
-
134
-
135
-
136
-
137
-
138
-
139
-
140
-
141
-
142
-
143
-
144
-
145
-
146
-
147
-
148
-
149
-
150
-
151
-
152
-
153
-
154
-
155
-
156
-
157
-
158
-
159
-
160
-
161
-
162
-
163
-
164
-
165
-
166
-
167
-
 168
168 -
 169
169 -
 170
170 -
 171
171 -
 172
172 -
 173
173 -
 174
174 -
 175
175 -
 176
176 -
 177
177 -
 178
178 -
 179
179 -
 180
180 -
 181
181 -
 182
182 -
 183
183 -
 184
184 -
 185
185 -
 186
186 -
 187
187 -
 188
188 -
189
-
190
-
191
-
192
-
193
-
194
-
195
-
196
-
197
-
198
-
199
-
200
-
201
-
202
-
203
-
204
-
205
-
206
-
207
-
208
-
209
-
210
-
211
-
212
-
213
-
214
-
215
-
216
-
217
-
218
-
219
-
220
-
221
-
222
-
223
-
224
-
225
-
226
-
227
-
228
-
229
-
230
-
231
-
232
-
233
-
234
-
235
-
236
-
237
-
238
-
239
-
240
-
241
-
242
-
243
-
244
-
245
-
246
-
247
-
248
-
249
-
250
-
251
-
252
 |
 |

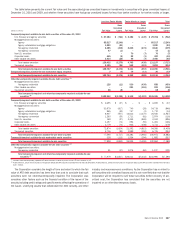
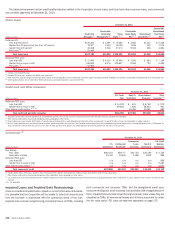
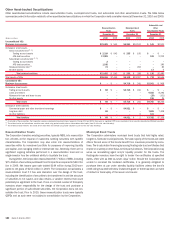
NOTE 7 Allowance for Credit Losses
The table below summarizes the changes in the allowance for credit losses for 2010, 2009 and 2008.
(Dollars in millions)
Home
Loans
Credit Card
and Other
Consumer Commercial 2010 2009 2008
Total Allowance
Allowance for loan and lease losses, January 1, before effect of the January 1 adoption of new
consolidation guidance
$ 15,756 $ 12,029 $ 9,415 $ 37,200
$ 23,071 $ 11,588
Allowance related to adoption of new consolidation guidance
573 10,214 1 10,788
n/a n/a
Allowance for loan and lease losses, January 1
16,329 22,243 9,416 47,988
23,071 11,588
Loans and leases charged off
(10,915) (20,865) (5,610) (37,390)
(35,483) (17,666)
Recoveries of loans and leases previously charged off
396 2,034 626 3,056
1,795 1,435
Net charge-offs
(10,519) (18,831) (4,984) (34,334)
(33,688) (16,231)
Provision for loan and lease losses
13,335 12,115 2,745 28,195
48,366 26,922
Other
107 (64) (7) 36
(549) 792
Allowance for loan and lease losses, December 31
19,252 15,463 7,170 41,885
37,200 23,071
Reserve for unfunded lending commitments, January 1
– – 1,487 1,487
421 518
Provision for unfunded lending commitments
––240240
204 (97)
Other
– – (539) (539)
862 –
Reserve for unfunded lending commitments, December 31
– – 1,188 1,188
1,487 421
Allowance for credit losses, December 31
$ 19,252 $ 15,463 $ 8,358 $ 43,073
$ 38,687 $ 23,492
n/a = not applicable
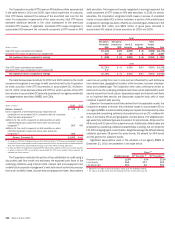
In 2010, the Corporation recorded $2.2 billion in provision for credit
losses with a corresponding increase in the valuation reserve included as part
of the allowance for loan and lease losses specifically for the PCI loan
portfolio. This compared to $3.5 billion in 2009 and $750 million in 2008.
The amount of the allowance for loan and lease losses associated with the PCI
loan portfolio was $6.4 billion, $3.9 billion and $750 million at December 31,
2010, 2009 and 2008, respectively.
The “other” amount under allowance for loan and lease losses for 2009
includes a $750 million reduction in the allowance for loan and lease losses
related to $8.5 billion of credit card loans that were exchanged for a $7.8 bil-
lion HTM debt security partially offset by a $340 million increase associated
with the reclassification to other assets of the amount reimbursable under
residential mortgage cash collateralized synthetic securitizations. The 2008
“other” amount under allowance for loan and lease losses includes the
$1.2 billion addition of the Countrywide allowance for loan losses as of July 1,
2008.
The “other” amount under the reserve for unfunded lending commitments
for 2009 includes the remaining balance of the acquired Merrill Lynch reserve
excluding those commitments accounted for under the fair value option, net
of accretion, and the impact of funding previously unfunded positions. This
amount in 2010 represents primarily accretion of the Merrill Lynch purchase
accounting adjustment and the impact of funding previously unfunded
positions.
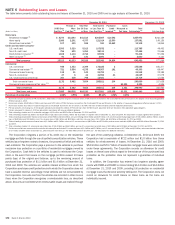
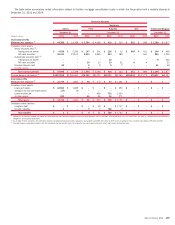
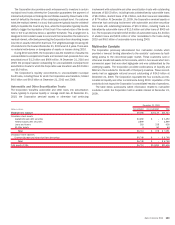
The table below represents the allowance and the carrying value of
outstanding loans and leases by portfolio segment at December 31, 2010.
(Dollars in millions)
Home Loans
Credit Card
and Other
Consumer Commercial Total
Impaired loans and troubled debt restructurings
(1)
Allowance for loan and lease losses
(2)
$ 1,871 $ 4,786 $ 1,080
$7,737
Carrying value 13,904 11,421 10,645
35,970
Allowance as a percentage of outstandings 13.46% 41.91% 10.15%
21.51%
Collectively evaluated for impairment
Allowance for loan and lease losses $ 10,964 $ 10,677 $ 6,078
$27,719
Carrying value
(3)
358,765 222,967 282,820
864,552
Allowance as a percentage of outstandings
(3)
3.06% 4.79% 2.15%
3.21%
Purchased credit-impaired loans
Allowance for loan and lease losses $ 6,417 n/a $ 12
$6,429
Carrying value 36,393 n/a 204
36,597
Allowance as a percentage of outstandings 17.63% n/a 5.76%
17.57%
Total
Allowance for loan and lease losses $ 19,252 $ 15,463 $ 7,170
$41,885
Carrying value
(3)
409,062 234,388 293,669
937,119
Allowance as a percentage of outstandings
(3)
4.71% 6.60% 2.44% 4.47%
(1)
Impaired loans include nonperforming commercial loans and all TDRs, including both commercial and consumer TDRs. Impaired loans exclude nonperforming consumer loans unless they are classified as TDRs, and all commercial
loans and leases which are accounted for under the fair value option.
(2)
Commercial impaired allowance for loan and lease losses includes $445 million related to U.S. small business commercial renegotiated TDR loans.
(3)
Outstanding loan and lease balances and ratios do not include loans accounted for under the fair value option. Loans accounted for under the fair value option were $3.3 billion at December 31, 2010.
n/a = not applicable
176 Bank of America 2010