Bank of America 2010 Annual Report Download - page 115
Download and view the complete annual report
Please find page 115 of the 2010 Bank of America annual report below. You can navigate through the pages in the report by either clicking on the pages listed below, or by using the keyword search tool below to find specific information within the annual report.-
 1
1 -
2
-
3
-
4
-
5
-
6
-
7
-
8
-
9
-
10
-
11
-
12
-
13
-
14
-
15
-
16
-
17
-
18
-
19
-
20
-
21
-
22
-
23
-
24
-
25
-
26
-
27
-
28
-
29
-
30
-
31
-
32
-
33
-
34
-
35
-
36
-
37
-
38
-
39
-
40
-
41
-
42
-
43
-
44
-
45
-
46
-
47
-
48
-
49
-
50
-
51
-
52
-
53
-
54
-
55
-
56
-
57
-
58
-
59
-
60
-
61
-
62
-
63
-
64
-
65
-
66
-
67
-
68
-
69
-
70
-
71
-
72
-
73
-
74
-
75
-
76
-
77
-
78
-
79
-
80
-
81
-
82
-
83
-
84
-
85
-
86
-
87
-
88
-
89
-
90
-
91
-
92
-
93
-
94
-
95
-
96
-
97
-
98
-
99
-
100
-
101
-
102
-
103
-
104
-
 105
105 -
 106
106 -
 107
107 -
 108
108 -
 109
109 -
 110
110 -
 111
111 -
 112
112 -
 113
113 -
 114
114 -
 115
115 -
 116
116 -
 117
117 -
 118
118 -
 119
119 -
 120
120 -
 121
121 -
 122
122 -
 123
123 -
 124
124 -
 125
125 -
126
-
127
-
128
-
129
-
130
-
131
-
132
-
133
-
134
-
135
-
136
-
137
-
138
-
139
-
140
-
141
-
142
-
143
-
144
-
145
-
146
-
147
-
148
-
149
-
150
-
151
-
152
-
153
-
154
-
155
-
156
-
157
-
158
-
159
-
160
-
161
-
162
-
163
-
164
-
165
-
166
-
167
-
168
-
169
-
170
-
171
-
172
-
173
-
174
-
175
-
176
-
177
-
178
-
179
-
180
-
181
-
182
-
183
-
184
-
185
-
186
-
187
-
188
-
189
-
190
-
191
-
192
-
193
-
194
-
195
-
196
-
197
-
198
-
199
-
200
-
201
-
202
-
203
-
204
-
205
-
206
-
207
-
208
-
209
-
210
-
211
-
212
-
213
-
214
-
215
-
216
-
217
-
218
-
219
-
220
-
221
-
222
-
223
-
224
-
225
-
226
-
227
-
228
-
229
-
230
-
231
-
232
-
233
-
234
-
235
-
236
-
237
-
238
-
239
-
240
-
241
-
242
-
243
-
244
-
245
-
246
-
247
-
248
-
249
-
250
-
251
-
252
 |
 |

determination of fair value, primarily based on historical experience adjusted
for any more recent name specific expectations.
Level 3 Assets and Liabilities
Financial assets and liabilities whose values are based on prices or valuation
techniques that require inputs that are both unobservable and are significant
to the overall fair value measurement are classified as Level 3 under the fair
value hierarchy established in applicable accounting guidance. The Level 3
financial assets and liabilities include private equity investments, consumer
MSRs, ABS, highly structured, complex or long-dated derivative contracts,
structured notes and certain CDOs, for which there is not an active market for
identical assets from which to determine fair value or where sufficient,
current market information about similar assets to use as observable, cor-
roborated data for all significant inputs into a valuation model is not available.
In these cases, the fair values of these Level 3 financial assets and liabilities
are determined using pricing models, discounted cash flow methodologies, a
net asset value approach for certain structured securities, or similar tech-
niques for which the determination of fair value requires significant manage-
ment judgment or estimation. In 2010, there were no changes to the quan-
titative models, or uses of such models, that resulted in a material
adjustment to the Consolidated Statement of Income.
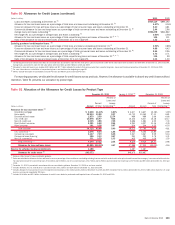
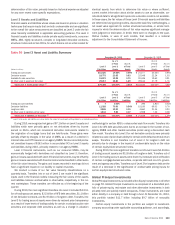
Table 56 Level 3 Asset and Liability Summary
(Dollars in millions)
Level 3
Fair Value
As a %
of Total
Level 3
Assets
As a %
of Total
Assets
Level 3
Fair Value
As a %
of Total
Level 3
Assets
As a %
of Total
Assets
December 31, 2010 December 31, 2009
Trading account assets
$15,525 19.56% 0.69%
$ 21,077 20.34% 0.95%
Derivative assets
18,773 23.65 0.83
23,048 22.24 1.03
Available-for-sale securities
15,873 19.99 0.70
20,346 19.63 0.91
All other Level 3 assets at fair value
29,217 36.80 1.29
39,164 37.79 1.76
Total Level 3 assets at fair value
(1)
$79,388 100.00% 3.51%
$103,635 100.00% 4.65%
Level 3
Fair Value
As a %
of Total
Level 3
Liabilities
As a %
of Total
Liabilities
Level 3
Fair Value
As a %
of Total
Level 3
Liabilities
As a %
of Total
Liabilities
Trading account liabilities
$ 7 0.05% –
$ 396 1.81% 0.02%
Derivative liabilities
11,028 70.90 0.54%
15,185 69.53 0.76
Long-term debt
2,986 19.20 0.15
4,660 21.34 0.23
All other Level 3 liabilities at fair value
1,534 9.85 0.07
1,598 7.32 0.08
Total Level 3 liabilities at fair value
(1)
$15,555 100.00% 0.76%
$ 21,839 100.00% 1.09%
(1)
Level 3 total assets and liabilities are shown before the impact of counterparty netting related to our derivative positions.
During 2010, we recognized net gains of $7.1 billion on Level 3 assets and
liabilities which were primarily gains on net derivatives driven by income
earned on IRLCs, which are considered derivative instruments related to
the origination of mortgage loans that are held-for-sale. These gains were
partially offset by changes in the value of MSRs as a result of a decline in
interest rates and OTTI losses on non-agency RMBS. We also recorded pre-tax
net unrealized losses of $193 million in accumulated OCI on Level 3 assets
and liabilities during 2010, primarily related to non-agency RMBS.
Level 3 financial instruments, such as our consumer MSRs, may be
economically hedged with derivatives not classified as Level 3; therefore,
gains or losses associated with Level 3 financial instruments may be offset by
gains or losses associated with financial instruments classified in other levels
of the fair value hierarchy. The gains and losses recorded in earnings did not
have a significant impact on our liquidity or capital resources.
We conduct a review of our fair value hierarchy classifications on a
quarterly basis. Transfers into or out of Level 3 are made if the significant
inputs used in the financial models measuring the fair values of the assets
and liabilities became unobservable or observable, respectively, in the cur-
rent marketplace. These transfers are effective as of the beginning of the
quarter.
During 2010, the more significant transfers into Level 3 included $3.2 bil-
lion of trading account assets, $3.5 billion of AFS debt securities, $1.1 billion
of net derivative contracts and $1.9 billion of long-term debt. Transfers into
Level 3 for trading account assets were driven by reduced price transparency
as a result of lower levels of trading activity for certain municipal auction rate
securities and corporate debt securities as well as a change in valuation
methodology for certain ABS to a discounted cash flow model. Transfers into
Level 3 for AFS debt securities were due to an increase in the number of non-
agency RMBS and other taxable securities priced using a discounted cash
flow model. Transfers into Level 3 for net derivative contracts were primarily
related to a lack of price observability for certain credit default and total return
swaps. Transfers in and transfers out of Level 3 for long-term debt are
primarily due to changes in the impact of unobservable inputs on the value
of certain equity-linked structured notes.
During 2010, the more significant transfers out of Level 3 were $3.4 billion
of trading account assets and $1.8 billion of long-term debt. Transfers out of
Level 3 for trading account assets were driven by increased price verification
of certain mortgage-backed securities, corporate debt and non-U.S. govern-
ment and agency securities. Transfers out of Level 3 for long-term debt are the
result of a decrease in the significance of unobservable pricing inputs for
certain equity-linked structured notes.
Global Principal Investments
Global Principal Investments is included within Equity Investments in All Other
on page 55. Global Principal Investments is comprised of a diversified port-
folio of private equity, real estate and other alternative investments in both
privately held and publicly traded companies. These investments are made
either directly in a company or held through a fund. At December 31, 2010,
this portfolio totaled $11.7 billion including $9.7 billion of non-public
investments.
Certain equity investments in the portfolio are subject to investment-
company accounting under applicable accounting guidance, and accordingly,
Bank of America 2010 113