Bank of America 2010 Annual Report Download - page 96
Download and view the complete annual report
Please find page 96 of the 2010 Bank of America annual report below. You can navigate through the pages in the report by either clicking on the pages listed below, or by using the keyword search tool below to find specific information within the annual report.-
 1
1 -
2
-
3
-
4
-
5
-
6
-
7
-
8
-
9
-
10
-
11
-
12
-
13
-
14
-
15
-
16
-
17
-
18
-
19
-
20
-
21
-
22
-
23
-
24
-
25
-
26
-
27
-
28
-
29
-
30
-
31
-
32
-
33
-
34
-
35
-
36
-
37
-
38
-
39
-
40
-
41
-
42
-
43
-
44
-
45
-
46
-
47
-
48
-
49
-
50
-
51
-
52
-
53
-
54
-
55
-
56
-
57
-
58
-
59
-
60
-
61
-
62
-
63
-
64
-
65
-
66
-
67
-
68
-
69
-
70
-
71
-
72
-
73
-
74
-
75
-
76
-
77
-
78
-
79
-
80
-
81
-
82
-
83
-
84
-
85
-
 86
86 -
 87
87 -
 88
88 -
 89
89 -
 90
90 -
 91
91 -
 92
92 -
 93
93 -
 94
94 -
 95
95 -
 96
96 -
 97
97 -
 98
98 -
 99
99 -
 100
100 -
 101
101 -
 102
102 -
 103
103 -
 104
104 -
 105
105 -
 106
106 -
107
-
108
-
109
-
110
-
111
-
112
-
113
-
114
-
115
-
116
-
117
-
118
-
119
-
120
-
121
-
122
-
123
-
124
-
125
-
126
-
127
-
128
-
129
-
130
-
131
-
132
-
133
-
134
-
135
-
136
-
137
-
138
-
139
-
140
-
141
-
142
-
143
-
144
-
145
-
146
-
147
-
148
-
149
-
150
-
151
-
152
-
153
-
154
-
155
-
156
-
157
-
158
-
159
-
160
-
161
-
162
-
163
-
164
-
165
-
166
-
167
-
168
-
169
-
170
-
171
-
172
-
173
-
174
-
175
-
176
-
177
-
178
-
179
-
180
-
181
-
182
-
183
-
184
-
185
-
186
-
187
-
188
-
189
-
190
-
191
-
192
-
193
-
194
-
195
-
196
-
197
-
198
-
199
-
200
-
201
-
202
-
203
-
204
-
205
-
206
-
207
-
208
-
209
-
210
-
211
-
212
-
213
-
214
-
215
-
216
-
217
-
218
-
219
-
220
-
221
-
222
-
223
-
224
-
225
-
226
-
227
-
228
-
229
-
230
-
231
-
232
-
233
-
234
-
235
-
236
-
237
-
238
-
239
-
240
-
241
-
242
-
243
-
244
-
245
-
246
-
247
-
248
-
249
-
250
-
251
-
252
 |
 |
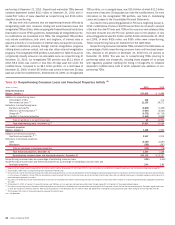
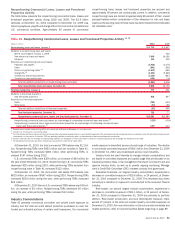
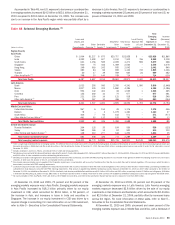
The $11.8 billion, or 34 percent, decline in individuals and trusts com-
mitted exposure was largely due to the unwinding of two derivative transac-
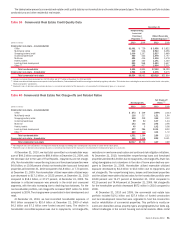
tions. Committed exposure in the banking industry increased $6.3 billion, or
27 percent, at December 31, 2010 compared to December 31, 2009
primarily due to increases in both traded products and loan exposure as a
result of momentum from growth initiatives. The decline of $4.5 billion, or
10 percent, in consumer services was concentrated in gaming and restau-
rants. Committed exposure for the commercial services and supplies industry
declined $4.1 billion, or 12 percent, primarily due to reduced loan demand
and the sale of First Republic.
The recent economic downturn has had a residual effect on debt issued by
state and local municipalities and certain exposures to these municipalities.
While historically default rates were low, stress on the municipalities’ finan-
cials due to the economic downturn has increased the potential for defaults in
the near term. As part of our overall and ongoing risk management processes,
we continually monitor these exposures through a rigorous review process.
Additionally, internal communications surrounding certain at-risk counterpar-
ties and/or sectors are regularly circulated ensuring exposure levels are
compliant with established concentration guidelines.
Monoline and Related Exposure
Monoline exposure is reported in the insurance industry and managed under
insurance portfolio industry limits. Direct loan exposure to monolines con-
sisted of revolvers in the amount of $51 million and $41 million at Decem-
ber 31, 2010 and 2009.
We have indirect exposure to monolines primarily in the form of guaran-
tees supporting our loans, investment portfolios, securitizations and credit-
enhanced securities as part of our public finance business and other selected
products. Such indirect exposure exists when we purchase credit protection
from monolines to hedge all or a portion of the credit risk on certain credit
exposures including loans and CDOs. We underwrite our public finance
exposure by evaluating the underlying securities.
We also have indirect exposure to monolines, primarily in the form of
guarantees supporting our mortgage and other loan sales. Indirect exposure
may exist when credit protection was purchased from monolines to hedge all
or a portion of the credit risk on certain mortgage and other loan exposures. A
loss may occur when we are required to repurchase a loan and the market
value of the loan has declined or we are required to indemnify or provide
recourse for a guarantor’s loss. For additional information regarding our
exposure to representations and warranties, see Note 9 – Representations
and Warranties Obligations and Corporate Guarantees to the Consolidated
Financial Statements and Representations and Warranties beginning on
page 56. For additional information regarding monolines, see Note 14 –
Commitments and Contingencies to the Consolidated Financial Statements.
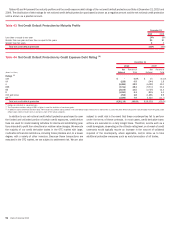
Monoline derivative credit exposure at December 31, 2010 had a notional
value of $38.4 billion compared to $42.6 billion at December 31, 2009.
Mark-to-market monoline derivative credit exposure was $9.2 billion at De-
cember 31, 2010 compared to $11.1 billion at December 31, 2009 with the
decrease driven by positive valuation adjustments on legacy assets and
terminated monoline contracts. At December 31, 2010, the counterparty
credit valuation adjustment related to monoline derivative exposure was
$5.3 billion compared to $6.0 billion at December 31, 2009. This reduced
our net mark-to-market exposure to $3.9 billion at December 31, 2010
compared to $5.1 billion at December 31, 2009. At December 31, 2010,
approximately 62 percent of this exposure was related to one monoline
compared to approximately 54 percent at December 31, 2009. We do not
hold collateral against these derivative exposures. For more information on
our monoline exposure, see GBAM beginning on page 49.
94 Bank of America 2010